In May 2026, a Morningstar Indexes strategist named Dan Lefkovitz published a warning that spread quickly through the dividend investing community. His argument: $22 billion flowed into dividend ETFs in Q1 2026 — the strongest inflow quarter since early 2022 — and historical flow data suggests crowded defensive buying tends to appear near market turning points, not before them. The comparison to 2022's $50 billion first-half inflow surge, followed by two years of relative underperformance, was pointed. But that same week, $711 million walked into SCHD while $3.27 billion walked out of QQQ. Before acting on any headline, income investors deserve a more rigorous framework than a pattern match alone.
Key Takeaways
- The 2026 rate regime differs fundamentally from 2022, making a direct historical comparison unreliable
- $711 million flowed into SCHD the same week $3.27 billion left QQQ — a rotation inside equities, not a panic exit
- SCHD, DGRO, VIG, and VYM are now embedded in retirement plans and advisor model portfolios, creating stickier inflows than 2022's hot money
- Dividend ETFs are designed to compound cash flow, not beat the S&P 500 — relative performance against SPY is the wrong measure for income builders
- The Three-Layer Lens (regime, cohort behavior, portfolio role) separates tactical warnings from strategic verdicts
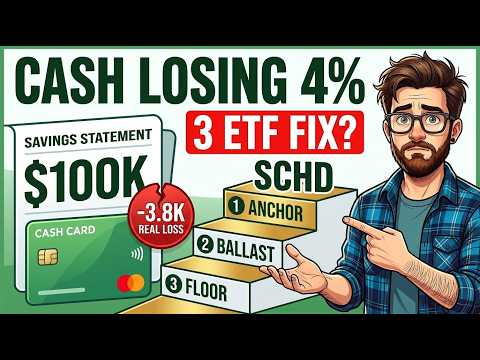
- Selling a $100,000 SCHD position on a headline costs roughly $3,200–$3,300 in annual income at current yield
What the Morningstar Warning Actually Says
Dan Lefkovitz's piece, published on May 20, 2026, argued that the surge of investor interest in dividend stocks looks less like genuine income-seeking and more like equity defense. His framing was direct: it is best to be invested in dividend stocks before you need defense, not after. As evidence, he cited five years of global dividend ETF flow history showing that crowded defensive buying has historically appeared near market turning points. His anchor comparison was the first half of 2022, when more than $50 billion flowed into dividend ETFs — followed by two years in which dividend strategies lagged the S&P 500 recovery in 2023 and 2024.
The data is real. As a pattern, it is coherent. As a complete picture for retirement income investors in 2026, it misses several structural shifts that have occurred in the intervening three years — specifically around the rate regime, the composition of the buyer cohort, and what dividend ETFs are actually supposed to accomplish inside a portfolio. Disclaimer: This article is not financial advice. Always do your own research before making any investment decision.
Layer One: The 2026 Rate Regime Is Not 2022
In 2022, the Federal Reserve was hiking rates by 75 basis points per meeting — an aggressive tightening cycle that demolished growth stocks and sent the Nasdaq down roughly a third of its value. Dividend ETFs outperformed by default because everything else was under severe pressure. The capital flowing in was predominantly a hot-money defensive trade looking for cover from an active growth crash.
In 2026, the Fed held rates steady on April 29 with the highest level of internal dissent seen in years. That is a higher-for-longer environment with real uncertainty — but it is not a rate-shock regime. The $3.27 billion that left QQQ on May 5 did not flee equities. Approximately $1.48 billion landed in VOO the same day. Another $711 million landed in SCHD over the course of that week. Capital moved inside equities, not out of them. That is a selective rotation, not a defensive panic — and those two behaviors do not produce the same outcome for dividend ETF investors.
This distinction matters because funds like SCHD, DGRO, VIG, and VYM do not need a panic environment to function. They need durable cash flow from companies with strong balance sheets to keep paying and growing distributions — which is precisely what a rate-paused environment accommodates. There is also a behavioral dimension the headline misses: in 2022, investors had not yet seen how dividend growth funds would behave through a sustained tightening cycle. By 2026, that data exists. Investors have watched SCHD continue raising distributions through a hostile rate environment, seen DGRO compound its payout, and seen VIG hold up through the worst growth drawdowns since the financial crisis. The buyer profile in 2026 is more experienced, more selective, and more structurally committed to income than the buyer who surged in three years earlier.
Layer Two: Sticky Money Versus Hot Money
The Lefkovitz piece describes 2026 inflows as crowded. The live flow data from that week describes something more specific: a rebalancing rotation into quality and cash flow. But the composition of the capital already inside these funds matters as much as the new inflows — and that composition has shifted substantially since 2022.
As of mid-2026, SCHD holds approximately $95 billion in assets. VIG holds approximately $102 billion. VYM holds roughly $65 billion. DGRO holds roughly $37 billion. These are not niche tactical vehicles. They are embedded in target-date portfolios, retirement accounts, and advisor model portfolios across millions of households. That is sticky capital. It does not exit the moment growth stocks recover the way speculative defensive money did in 2023 and 2024. The structural composition of assets under management inside these funds today is fundamentally different from what existed in early 2022.
It also helps to understand what is actually inside SCHD. The fund holds names like Texas Instruments, Qualcomm, UnitedHealth, Chevron, Coca-Cola, ConocoPhillips, Merck, Verizon, PepsiCo, and Procter & Gamble — a portfolio spanning consumer defensive, health care, energy, financial services, and technology. When a warning flags crowded defense, the implication is speculative capital seeking temporary shelter in a single theme. The earnings power embedded in SCHD's holdings funds buybacks and dividend hikes regardless of which direction the broader market drifts. That is a materially different risk profile than a single-sector defensive pile-in.
The $711 million weekly inflow into SCHD is not the sound of a crowded crash trade. It is the sound of investors choosing the cash flow game over the benchmark chase.
For broader context on how capital has rotated across the ETF landscape in 2026, the full analysis in ETF Inflows Break Records in 2026: SCHD, VOO, and the $524B Flow Map covers the structural rotation in detail.
Layer Three: Relative Performance Is the Wrong Benchmark
This is where the Morningstar warning and the income-investor audience talk past each other most directly. The Lefkovitz warning measures dividend ETF performance against the S&P 500 — a relative performance frame. The argument is that SCHD, DGRO, VIG, and VYM may underperform SPY going forward. That may be true. But it is the wrong question for the majority of investors holding these funds, because those investors are not benchmark chasers. They are income builders.
Income builders track three numbers the relative performance frame cannot capture: yield on their invested capital, dividend growth rate — the annual pace at which that income increases — and drawdown durability, meaning the fund's ability to sustain distributions through market stress. A relative performance lag can be severe on a chart and still be irrelevant to a retirement income plan, because the dividend keeps landing in the account regardless of whether the benchmark stretches further ahead in any given twelve-month window.
Here is how the core lineup looks on those metrics as of mid-2026. SCHD carries a yield of approximately 3.2–3.3% with a 0.06% expense ratio. DGRO runs a yield of approximately 2.2–2.5% with a 0.08% expense ratio and a five-year dividend growth rate near 9–10%. VIG carries a yield of roughly 1.7–2.0% with one of the lowest expense ratios in the category and a five-year dividend growth rate near 9.4%. VYM yields approximately 2.7–3.1% with a five-year dividend growth rate of 6–7%. None of these funds were designed to beat SPY. They were designed to compound cash flow. The Morningstar US Core Bond Index yields around 4.5% as of mid-2026, and the Morningstar US High Dividend Yield Index yields roughly 2.3% — so on pure yield, bonds currently win. But dividend growth, qualified tax treatment on distributions, and equity participation are arguments pure yield comparisons cannot address. For investors with a five-to-twenty-year horizon, a growing income stream compounds in ways a fixed bond coupon cannot match. For a detailed comparison of how DGRO and SCHD diverge on dividend growth metrics and what that means for long-term compounders, see DGRO vs SCHD: The Dividend Growth Stall Investors Need to See.
The Real Cost of Acting on a Headline
Consider an investor who built a $100,000 SCHD position during the 2022 drawdown and watched it lag the S&P 500 for two consecutive years without selling. By May 2026, that allocation has continued generating quarterly distributions, reinvesting shares, and compounding at a pace that patient holders capture and panic sellers give away. The Lefkovitz warning is not the threat — the reaction to it is.
If that investor sold his $100,000 SCHD position the day after the Morningstar piece dropped, the opportunity cost would have included roughly $3,200–$3,300 in annual income at current yield, the next quarterly distribution, and whatever reinvestment shares he would have accumulated at that price. If he tried to re-enter six months later at a higher price, he would buy back fewer shares — resetting the compounding clock and locking in the gap permanently. The cost of acting on a relative performance warning is not just the benchmark lag. It is the income stream interrupted, the compounding reset, and the reinvestment shares never purchased.
The trap to avoid is reading a relative performance warning as a strategic verdict. That is the decision error that has historically transferred wealth from impatient holders to patient ones. Every time a credentialed analyst publishes a contrarian piece, a portion of the audience reads it as a sell signal regardless of whether their own portfolio role maps to the warning's actual frame. The Three-Layer Lens — regime, cohort behavior, portfolio role — is a way to slow that reaction down long enough to ask the right question: is this warning talking to you, or talking past you? For traders optimizing twelve-month relative performance against the S&P 500, the inflow crowding data is a legitimate input. For income builders with a five-to-twenty-year horizon, the warning describes someone else's trade entirely.
Watch the Full Breakdown on YouTube
For a visual walkthrough of the Three-Layer Lens applied to the live flow data, a complete analysis of SCHD's holdings, and a side-by-side comparison of SCHD, DGRO, VIG, and VYM on yield, dividend growth rate, and drawdown durability, watch the full video on the Harry's Financial Fitness YouTube channel. The video covers the week-specific flow data in detail — including the $711 million SCHD inflow and the $3.27 billion QQQ outflow — and walks through the opportunity cost calculation for a $100,000 SCHD position step by step. Drop a comment on the video with which fund you actually hold: SCHD, DGRO, VIG, or VYM.