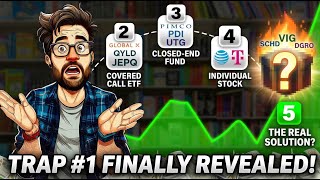
A retired electrician once put four hundred thousand dollars into a single mortgage REIT because the yield read fourteen percent. The income arrived every month, predictable as clockwork — until the share price fell sixty percent from peak to trough and the dividend itself shrank year after year. The yield had not lied. It had told the truth in a language most investors have never been taught to read.
That was one trap. There are twelve more, and together they form the thirteen most historically destructive dividend mistakes in retirement portfolios. What makes each one dangerous is not greed — it is reasonableness. Every trap on this list looks like sound income strategy at first glance. What follows is a ranked walkthrough of all thirteen, in the order they tend to do the most damage, so the pattern is visible before real capital is committed.
Nothing in this article is financial advice. All figures cited are historical data or hypothetical scenarios based on published sources. Past performance does not guarantee future results.
Key Takeaways
- Mortgage REITs and covered call ETFs advertising double-digit yields often destroy capital through share price erosion even while delivering monthly income.
- Account placement — putting JEPI in a taxable account instead of a Roth — can cost more than $50,000 in lifetime income on a $100,000 position over a 20-year retirement.
- SCHD and DGRO share 35 holdings and roughly 20% weight overlap; owning both adds expense and behavioral complexity without meaningful diversification.
- The first ten years of retirement carry the highest sequence-of-returns risk; a two-to-three-year cash buffer has historically neutralized this threat.
- A dividend growth ETF yielding 3.5% with 7% annual distribution growth has historically produced more than double the income of a fixed Treasury bond within fifteen years.
- Stopping dividend reinvestment prematurely is one of the most costly and least visible mistakes a retirement investor can make.
The Four Yield-Chasing Traps
The first category of dividend mistakes shares a common thread: an outsized headline yield that compensates investors for capital risk the market has already priced in.
Trap 1: High-Yield Mortgage REITs (AGNC, Annaly)
Mortgage REITs like AGNC Investment and Annaly Capital Management have long advertised forward yields in the low-to-mid teens. The problem surfaces when price history is examined alongside the yield. Over the past decade, AGNC's share price compounded at roughly negative five percent per year, and the dividend itself declined on a compound basis by close to the same amount annually. Total return with reinvestment remained positive — approximately six and a half percent annually — but Annaly has historically experienced peak-to-trough drawdowns near sixty percent during stress periods, turning a four-hundred-thousand-dollar position into one hundred and sixty thousand dollars in a matter of months. When a yield is two to three times the broad dividend market, investors are being paid to absorb real capital risk, not collecting free income.
Trap 2: Covered Call ETF Yields (QYLD, RYLD)
QYLD and RYLD distribute yields in the eleven-to-twelve percent range. Over the five years ending in recent data, QYLD delivered an annualized total return of approximately 3.8 percent while QQQ — the underlying Nasdaq 100 index — compounded at roughly fifteen percent. A $10,000 investment would be worth approximately $12,000 in QYLD versus roughly $20,200 in QQQ over the same period. In 2023 alone, QYLD returned about twenty-two percent while QQQ returned roughly fifty-four percent. The covered call structure caps upside in every strong year; the headline yield is not free — investors pay for it in foregone capital growth.
Trap 3: Closed-End Fund Distribution Traps (PDI, UTG)
Funds like PIMCO Dynamic Income (PDI), carrying yields near fifteen percent, attract retirees with steady monthly distributions. The structural danger is that closed-end funds trade at premiums and discounts to net asset value, and their headline yields frequently blend genuine portfolio income with return of capital — the fund handing investors their own principal back, labeled as a dividend. CEFConnect data shows that in 2020, PDI's NAV total return was a positive 2.4 percent while the market price total return was a negative 9.5 percent. Before buying any closed-end fund, compare the NAV total return to the stated distribution yield and read the fund's 19a notices to identify what portion of each distribution is genuine income versus capital being returned.
Trap 4: Individual Stocks Yielding Over 8%
When a domestic large-cap stock yields more than eight percent, the market is pricing an elevated probability of a dividend cut. AT&T illustrated this precisely. At the end of January 2022, the dividend yield sat at approximately 8.2 percent. Within months, AT&T cut its annual dividend from $2.08 to $1.11 per share — a forty-six percent reduction. An investor projecting $8,200 in annual income from a $100,000 position suddenly faced approximately $4,400. The warning signs were visible in advance: a frozen dividend, a rising debt load, and declining free cash flow — factors the market had already embedded in the elevated yield before the cut was announced.
The Five Structural Account Traps
These mistakes do not depend on which fund an investor selects. They depend entirely on where that fund is held.
Trap 5 — Filling Roth space with moderate-yield dividend ETFs: SCHD has historically returned approximately thirteen percent per year since its 2011 inception. QQQ has compounded at roughly fifteen to seventeen percent over similar periods. Because Roth IRA growth is permanently tax-free, the highest-expected-return assets historically belong there. Using that space for a moderate-yield fund whose qualified dividends already receive favorable tax treatment in a taxable account is a structural mismatch. The ETF is not the problem. The container is.
Trap 6 — JEPI and JEPQ in a taxable account: JEPI has shown a trailing twelve-month yield around 8.56 percent, with a meaningful portion taxed as ordinary income because option premiums do not qualify for long-term capital gains rates. In a 32 percent ordinary income bracket, a $100,000 position generating $8,560 annually produces approximately $5,821 in spendable income after taxes — a thirty-two percent reduction caused entirely by account placement. Multiplied across twenty years of retirement, that single decision costs more than $50,000 in lifetime income. Inside a Roth, those same distributions arrive tax-free under current rules.
Trap 7 — Overlapping dividend ETF stacks: According to the ETF Research Center's overlap tool, SCHD and DGRO share thirty-five holdings with roughly twenty percent weight overlap, including UnitedHealth, Procter & Gamble, Home Depot, Merck, and Coca-Cola. Morningstar's Mind the Gap research found that complexity and behavioral costs associated with overlapping fund stacks contribute to a return gap of approximately 1.1 percentage points per year — turning a $100,000 account compounding at 7.3 percent (roughly $202,000 over a decade) into one compounding at 6.3 percent (roughly $184,000), an $18,000 difference for zero added diversification. For a detailed head-to-head comparison of these two funds, see DGRO vs SCHD: The Dividend Growth Stall Investors Need to See.
Trap 8 — Chasing high yield instead of dividend growth: The highest-yielding stocks in any given year — particularly those above eight or nine percent — have historically underperformed dividend growers and the broad market. VIG has compounded at approximately ten percent per year since 2006, VYM at about nine percent, and SCHD at thirteen percent since inception. The dividend is a signal of company quality, not a substitute for total return. Companies that can sustain and grow a dividend across two decades tend to be profitable, capital-disciplined, and resistant to fad cycles — and that operational quality, not the yield itself, is what has driven historical outperformance in dividend indexes.
Trap 9 — Ignoring sequence-of-returns risk in early retirement: Research from Wade Pfau and Michael Kitces identifies the first decade of retirement as the highest-risk window — more consequential than every subsequent decade combined. If dividends cover seventy percent of spending and the market drops forty percent, the remaining thirty percent still requires selling depressed shares. The historical solution is a buffer of two to three years of expenses in cash or short-duration bonds. A sixty-four-year-old with $800,000 and $40,000 in annual spending needs only $80,000 in a cash buffer — ten percent of the portfolio — to protect the other ninety percent through the most dangerous sequence-risk window of any retirement.
The Four Behavioral Traps
Trap 10 — Selling during a market crash: Morningstar's Mind the Gap study for the ten years ending December 31, 2023 found that the average fund investor earned 6.3 percent per year while the funds they held earned 7.3 percent. That one-percentage-point gap was almost entirely behavioral — buying after strong performance and selling after poor performance. A $100,000 portfolio falling to $60,000 in a forty-percent decline becomes a permanent loss the moment shares are sold. Those who held through the 2020 crash were back to even within months. The discipline that prevents panic selling is established before the crash: a written investment policy, a cash buffer, and an accountability partner who knows the plan.
Trap 11 — Stopping dividend reinvestment too early: A $10,000 position in SCHD at its 2011 inception with dividends fully reinvested grew to approximately $60,200 by spring 2026 — a six-fold increase. Without reinvestment, the terminal value falls materially short, often by tens of thousands of dollars. Compounding is multiplicative: a dollar reinvested at year twenty-five contributes more in absolute terms to the thirty-year terminal value than a dollar invested at year five. If the income is not needed for current expenses, leaving the DRIP active is historically one of the highest-return decisions a long-term investor can make. For a concrete illustration of what early stoppage costs in real dollars, see Pausing Dividend ETFs for 6 Months: The $13,900 Mistake.
Trap 12 — Trusting monthly distributions without verifying the source: Monthly distributions feel comforting because they align with the cadence of household bills. The trap is assuming monthly frequency equals income quality. Many closed-end funds and option-income ETFs smooth monthly distributions using return of capital — the fund returning the investor's own principal labeled as a dividend. Before relying on any monthly distribution fund, compare the twelve-month NAV total return to the stated yield; if the NAV return is materially below the yield, the gap is likely return of capital. Reading the fund's most recent 19a notice and reviewing the year-end 1099-DIV breakdown — showing what portion qualifies as ordinary income, qualified dividends, capital gains, or return of capital — provides the full picture before a problem compounds.
Trap 13: The Quiet Retirement Trap Most Investors Are Already Inside
The final mistake is not a fund selection error or a behavioral failure. It is the belief that bond yields alone can sustain a retirement lasting twenty-five to thirty years.
The ten-year U.S. Treasury yield sat at 4.32 percent in April 2026, per Federal Reserve data. A retiree with $1,000,000 in Treasuries can project $43,200 per year in government-backed income. The appeal is understandable. The math breaks down across three distinct layers.
Layer 1 — Inflation erosion: At three percent annual inflation, a 4.32 percent nominal yield becomes approximately 1.3 percent in real terms. Federal Reserve data combined with Long Term Trends research shows that the ten-year real yield spent most of the 2010s at or below zero. A million dollars growing at 1.3 percent real produces dramatically less purchasing power over twenty-five years than the headline suggests, and the inflation-adjusted income shrinks every year the cost of living rises.
Layer 2 — No income growth: A bond pays a fixed coupon. A dividend-growing equity does not. Consider a retiree with $1,000,000 choosing between two paths. Path A is a 100 percent Treasury allocation at 4.32 percent: $43,200 in year one, $43,200 in year fifteen, $43,200 in year twenty-five. Path B is a quality dividend ETF historically yielding 3.5 percent with seven percent annual distribution growth: $35,000 in year one, approximately $96,000 by year fifteen, with the underlying principal still growing at historical total returns in the eleven-to-thirteen percent range. The bond wins in year one. By year fifteen, it is not competitive on income, and the underlying principal has not grown in nominal terms — let alone real ones.
Layer 3 — The bond ladder fallacy: Many retirees build a ten-year Treasury ladder, feel protected, and stop adding equity exposure entirely. A thirty-year retirement is not a ten-year problem — it is three consecutive ten-year problems, each with its own inflation environment. A portfolio that cannot grow real income through all three historically runs out of purchasing power before the runway ends. The fix is not to abandon bonds, which serve critical roles in sequence-of-returns protection and volatility management. The fix is to pair a bond allocation with a dividend-growing equity component that has, across most thirty-year market windows, delivered both the income and the inflation hedge that fixed-rate instruments structurally cannot provide on their own.
Watch the Full Video Breakdown
The mechanics behind each of these thirteen traps — the compound rate calculations, historical drawdown data, the tax math on JEPI, and the thirty-year bond-versus-dividend income comparison — are walked through in detail in the original video on the Harry's Financial Fitness YouTube channel. The visual presentation reinforces the shape of each mistake in a way that text alone may not fully capture: 13 Dividend MISTAKES That Wreck Retirement Portfolios.
Every number cited here is a historical figure or hypothetical scenario based on published data. The goal is to show how money behaves inside each mistake — so the pattern is recognizable before capital is committed, not after.