- Key Takeaways
- Early Years (2009–2014): When Emotion Drives Every Decision
- Middle Years (2015–2020): Learning That Yield Is Not Return
- Maturing Years (2021–2026): The Lessons That Should Have Been Free
- The Synthesis: The One Decision That Paid for Every Other Mistake
- Watch the Full Video Retrospective
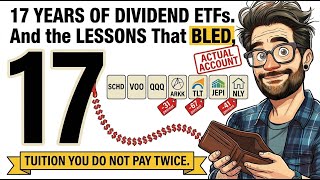
On March 9, 2009, the S&P 500 closed at 676.53 — the bottom of the worst market crash since the Great Depression. The instinct that day was to sell. Not everything, but enough to miss roughly 65 percent of the recovery that followed over the next nine months. What came after was a seventeen-year education in the gap between what investing looks like and what it actually costs. This article documents eighteen hard lessons from that period, each anchored to a specific date, a specific mistake, and a real dollar figure. Nearly all of them are still costing retail investors money today.
Key Takeaways
- The Dalbar QAIB report found the average equity fund investor earned approximately 16.5% in 2024 versus the S&P 500's 25% return — a gap worth $12,246 on a $100,000 starting balance in a single year.
- Owning six dividend ETFs simultaneously (SCHD, DGRO, VYM, VIG, NOBL, DVY) often means paying six expense ratios to own the same 40 large-cap dividend payers in slightly different weights.
- Mortgage REIT yields above 10% are a market warning, not an opportunity. NLY and AGNC cut distributions repeatedly; the headline yield at the purchase date was fictional within two years.
- TLT fell 31.41% in 2022 — more than the S&P 500 in the same calendar year — while AGG reached its worst-ever drawdown of 18.43% in October of that year.
- SCHD has compounded at approximately 12.89% annually since its October 2011 inception. A $10,000 investment at inception is worth roughly $56,900 today in nominal terms.
- $500 per month into a broad index fund from March 2009 — $102,000 in total contributions over 204 months — could have grown to between $265,000 and $400,000 with no market timing or stock selection.
Early Years (2009–2014): When Emotion Drives Every Decision
Lesson 1: Single-Stock Concentration Is Not Conservatism
In early 2009, nearly half a brokerage account sat in three blue-chip dividend stocks: General Electric, AT&T, and IBM. The logic was familiar — these companies had paid dividends longer than most investors had been alive. GE cut its dividend from 31 cents per quarter to 10 cents in February 2009, the first GE dividend cut since the Great Depression. By 2018, it had been cut again to one cent per quarter. AT&T eventually cut its dividend by approximately 47 percent in 2022 following the WarnerMedia spinoff. IBM became a slow, multi-year underperformance against the broad index that only became visible in direct comparison.
Research from finance professor Hendrik Bessembinder found that just 4 percent of all stocks account for the entire net stock market gain over Treasury bills since 1926. Owning 10 to 20 individual names produces poor odds of capturing the companies that do the actual compounding work. Diversification is not optional — it is the price of admission to sustainable long-term returns.
Lesson 2: Panic Selling at the Bottom Has a Precise Cost
The S&P 500 closed at 676.53 on March 9, 2009. A sell order executed on March 10. By year-end, the index had closed at approximately 1,115 — a gain of roughly 65 percent in nine months from the bottom. Nearly all of that recovery was missed.
The Dalbar QAIB report tracks the gap between what the market returned and what the average equity fund investor actually earned. In 2024, the S&P returned approximately 25% while the average equity fund investor earned approximately 16.5% — a gap of 848 basis points. On a $100,000 starting balance, that is a $12,246 shortfall in a single calendar year. Over the trailing ten years, the average equity fund investor has earned roughly 9.8% annually versus the S&P's approximately 13% annual compounding rate.
Selling at the bottom felt logical at the time. It remains the most expensive logical decision across seventeen years of investing.
Lessons 3 and 4: Yield Traps and ETF Overlap
In the early 2010s, Annaly Capital (NLY) and AGNC Investment Corp were advertising distribution yields above 10 percent. Both are mortgage real estate investment trusts — businesses sensitive to interest rate spreads in ways that show up violently when the yield curve moves. Both cut their distributions. Then cut again. The price drifted down to match the lower payouts, and the headline yield at the time of purchase became fiction within two years. The total loss on those positions exceeded the cost of a first car. Any yield that sits meaningfully above everything else on the screen is a market signal about embedded risk, not an overlooked opportunity that everyone else has missed.
By 2013, the same portfolio held SCHD, DGRO, VYM, VIG, NOBL, and DVY simultaneously under the assumption of diversification. The reality was paying six separate expense ratios to own the same 40 large-cap dividend payers in slightly different weightings. Free overlap tools at ETFRC.com and ETFDB.com show exactly how much any two ETFs share in common holdings. The structural fix is one core dividend ETF, one genuine complement that owns a meaningfully different segment, and nothing else that replicates the same mandate. For a direct performance comparison of how similar dividend funds diverge over time, see the DGRO vs SCHD total return analysis.
Lessons 5 and 6: Contribution Pauses and Mistimed Rotations
During the European debt crisis in 2011, when the S&P fell approximately 19 percent between late April and early October, automatic contributions paused for four months — and then stayed paused for another two due to inattention. Six months of missed contributions in an investor's early thirties, compounded forward over 25 years at the long-run market average, represents tens of thousands of dollars that cannot be recovered. The market will produce a hundred reasons to pause contributions. Almost none of them survive as justifications in hindsight.
In May 2013, Federal Reserve Chair Bernanke's hint at tapering asset purchases sent the 10-year Treasury yield from approximately 1.94% to 2.96% in four months. Half of equity exposure rotated to cash in response. The Fed delayed actual tapering until December because the market reaction exceeded expectations, and the S&P had one of its best calendar years of the decade. The lesson is not about the taper announcement itself — it is about confusing a policy signal with a market forecast. It is possible to be precisely right about the Federal Reserve's direction and wrong about everything that matters to a portfolio. The full arithmetic of what contribution pauses actually cost across a six-month window is covered in the companion piece on the $13,900 cost of pausing dividend ETF contributions.
Middle Years (2015–2020): Learning That Yield Is Not Return
Lessons 7 and 8: Cyclical Sector Bets and Cash Drag
WTI crude oil peaked around $107 per barrel in summer 2014 and fell to roughly $26 by February 2016 — a 75 percent drawdown in the underlying commodity in under two years. Adding to a basket of energy names and a master limited partnership through the entire decline, on the thesis that oil always recovers, produced severe losses. Kinder Morgan cut its distribution by approximately 75 percent in a single December 2015 press release. Multiple MLPs followed with distribution cuts through 2015 and 2016. The energy sector did eventually recover, but it took most of the following decade. Cyclical sectors can take five, ten, or fifteen years to fully recover. A retirement portfolio's clock does not align with the commodity cycle's timeline.
A parallel mistake ran from January 2015 to December 2017: the S&P moved from approximately 2,058 to 2,673 with dividends reinvested while cash sat in money market funds yielding below half a percent, waiting for a better entry point. When the correction finally came in Q1 and Q4 2018, the entry price available was higher than the price that had been refused years earlier. Cash on the sidelines is not safe — it is paying a tuition called opportunity cost, and that tuition compounds daily alongside the market it is waiting to beat.
Lesson 9: Total Return Is the Only Number That Pays Bills in Retirement
SCHD launched on October 20, 2011. Its current yield has rarely been the highest on the screen, which made high-yield alternatives like SDY and SPHD more attractive at first glance in the early 2010s. The long-term comparison resolved the question: SCHD has returned approximately 10.73% annualized over the trailing ten years, 9.66% over the trailing five years, and roughly 12.89% annually since inception. A $10,000 investment at inception is worth approximately $56,900 today in nominal terms, or roughly $39,100 adjusted for inflation. Most high-yield alternatives have lagged these figures over the same span, sometimes by meaningful margins.
Yield is one component of return. Total return — the sum of yield, price appreciation, and dividend growth — is the only number that actually pays bills in retirement. A fund that pays 6% and never grows its principal or dividend is slowly liquidating itself. A fund that pays 3.5% and grows both at 10% annually is compounding wealth quietly in the background. The choice between them is not close.
The headline yield is what a new dollar earns today. The dividend growth rate is what existing dollars pay in retirement — and they are often very different numbers pointing toward very different futures.
Lessons 10 and 11: Allocation Drift and Leverage
A 60/40 stock-bond allocation set in 2015 had quietly drifted to approximately 75/25 by Q3 2018 because equities outperformed and rebalancing had been skipped. When the S&P fell 19.8% between late September and Christmas Eve 2018, the drawdown was meaningfully larger than a maintained 60/40 would have produced. The plan had not changed — only its enforcement had lapsed. Rebalancing twice per year on a fixed calendar schedule is the discipline that returns a portfolio to the version of itself designed under calm conditions, rather than the version that has drifted toward whatever has been winning.
The more expensive mistake was holding a 3x leveraged Nasdaq ETF inside a tax-advantaged account in late 2021 on the logic that a long time horizon justified the math. In 2022, QQQ fell approximately 32%. The 3x leveraged version did not fall 96% — it fell approximately 79%, because daily rebalancing in leveraged ETFs creates beta slippage. A series of alternating up-and-down moves of similar magnitude grinds principal down even when the underlying eventually ends roughly flat. In a tax-advantaged account, that loss cannot be harvested against capital gains. It is eaten permanently. Leverage in a long-horizon account is a category error in both directions simultaneously: it increases variance and decreases compounding.
Maturing Years (2021–2026): The Lessons That Should Have Been Free
Lesson 12: The Second Crash Is Proof That the First One Worked
The S&P peaked on February 19, 2020 and fell roughly 34 percent by March 23 — a 60,000-dollar account drawdown in five weeks. The temptation to go to cash was real. What stopped it was a single reminder: the panic tuition had already been paid in 2009, and paying it twice would be a voluntary expense. The position held. By February 19, 2021, the S&P sat at 115 percent of its pre-COVID peak — 15 percent above the prior high in roughly twelve months. Wells Fargo cut its dividend approximately 80 percent during that period. Disney and Boeing suspended theirs entirely. Real dividends, from real blue-chip names that real retirees had been counting on. Some never came back. But the index recovered, and the investors who held through it kept the full recovery. Experience is the cheapest form of market insurance available.
Lesson 13: When Narrative Moves Price Faster Than Fundamentals
ARKK peaked around $158 in early 2021 on a story of disruption and innovation. Meaningful capital rotated into ARKK and into high-multiple names including PLTR, RIVN, and COIN. ARKK fell into the $30–$35 range within two years. RIVN, which IPO'd at approximately $78 per share in late 2021, collapsed by a severe multiple in the 18 months that followed. COIN's direct listing reference price of roughly $381 in April 2021 looked like a different market within a single year. The total drawdown on that growth sleeve was the worst single-year percentage loss across seventeen years of investing — worse than 2009 on a percentage basis — because the names were correlated and broke simultaneously. When growth stocks without earnings go out of fashion, the exit is not a rotation. It is a liquidation: every redemption from a thematic ETF triggers more selling of underlying names, which drives prices lower, which triggers more redemptions.
Lesson 14: Long-Duration Bonds Are Not the Safety Net They Appear to Be
TLT, the long bond ETF, fell 31.41% in calendar year 2022 — more than the S&P 500 in the same year. AGG, the total bond market ETF, fell 13.02% and reached its worst-ever drawdown of 18.43% in October of that year. 1964 was the last time something comparable occurred in U.S. bonds. As of April 2026, TLT's maximum drawdown from its peak is still in progress at approximately negative 47%.
A 13% loss in the bond sleeve hits investors in the withdrawal phase doubly: distributions come out of an asset that is simultaneously declining in value, compounding sequence-of-returns risk. Long-duration Treasuries in a rising-rate environment behave like volatile equities with worse upside potential. Knowing a bond fund's duration is as essential as knowing equity exposure — without it, a critical instrument is missing from the portfolio cockpit.
Lesson 15: Asset Location Is a Free Return Most Investors Leave Unclaimed
Funds like JEPI (the JPMorgan Equity Premium Income ETF) distribute most of their income from selling options premium, which is generally taxed as ordinary income rather than as qualified dividends. Holding a six-figure JEPI position in a regular taxable brokerage account for two full tax years, before a CPA flagged the error, meant paying the full federal income bracket on every distribution. The correct account for these funds is tax-advantaged — a Roth IRA, traditional IRA, or 401(k) — where the ordinary income character of the distributions is irrelevant. Asset location is one of the largest free returns available to a long-term investor, and it is completely invisible until tax time arrives.
The Synthesis: The One Decision That Paid for Every Other Mistake
The arithmetic that closes all eighteen lessons is straightforward. An investor who contributed $500 per month into a low-cost S&P 500 index fund from March 2009 through 2026 — 204 months, $102,000 in total contributions — could potentially have accumulated between $265,000 and $400,000, depending on the assumed compound rate. The lower bound represents more than $163,000 of growth on $102,000 in contributions, generated with no skill, no timing, and no stock selection required. The same $500 per month sitting in a savings account over the same window would have produced barely more than the contributions themselves, because average savings account yields stayed below half a percent for most of that period.
Scaled to $1,000 per month into VOO (the Vanguard S&P 500 ETF), the figures become harder to set aside. Total contributions of $204,000 over 204 months could potentially have grown to between $530,000 and $827,000, with a midpoint in the $600,000–$700,000 range. Against that benchmark, every mistake in the list above — concentration risk, panic selling, yield chasing, ETF overlap, contribution pauses, market timing, energy bets, cash drag, allocation drift, leverage, growth speculation, long-duration bonds, and asset location errors — was an attempt to outperform the index. Every single one of those attempts cost real money.
SPIVA data — the long-running S&P Dow Jones scorecard — has shown for two decades that more than 90% of active large-cap funds underperform the broad index over 20-year periods. The Dalbar trailing-ten-year data shows the average equity fund investor earning roughly 9.8% annually against the S&P's approximately 13% annual return. That gap is the aggregate cost of cleverness, measured across millions of investor accounts.
The conclusion that closes every lesson on this list: automatic monthly contributions into a broad index fund were always available, always free, and always boring. They would have made every other mistake invisible — swallowed whole by the compounding that required nothing except consistency. Seventeen years of tuition paid for this list. Reading it carefully is the cheaper version of the same education.
Watch the Full Video Retrospective
The video version of this retrospective covers all eighteen lessons with additional context on the ARKK and leveraged ETF math, the exact yield-on-cost calculations for SCHD from a 2014 starting position, and a closing segment on the portfolio built after all eighteen lessons were paid for — including which ETFs would be purchased first if starting from zero today. Watch the complete retrospective on YouTube: 17 Years of Investing — The Hard Lessons That Cost Me Real Money.