According to the DALBAR Quantitative Analysis of Investor Behavior report, the average equity investor trailed the S&P 500 by 848 basis points in 2024. The index returned 25% that year; the average investor took home roughly 16.5%. On a $100,000 account, that gap amounts to approximately $8,500 in a single year. Nearly all of that shortfall came not from selecting the wrong fund, but from getting the simple things wrong — account sequencing, fund location, and the discipline to stay invested during market stress.
The twenty lessons below are divided into three chapters: early mistakes that cost investors in the first three years, mid-game errors that quietly drain portfolios between year five and year fifteen, and late-game decisions that determine whether a retirement account lasts or runs short.
Key Takeaways
- Capture the full employer 401(k) match before directing a dollar to a taxable brokerage account
- Fund the Roth IRA to its annual limit before contributing to taxable accounts — unused contribution room is permanently forfeited each year
- Covered call ETFs like JEPI and JEPQ generate ordinary income and belong in tax-advantaged accounts, not taxable brokerage accounts
- TLT lost more than 31% in 2022 — long-duration bond funds carry significant interest rate risk even when credit quality is high
- Dollar-cost averaging on autopilot consistently outperforms market-timing strategies over decade-long horizons
- The Coast FIRE number shows exactly how much you need invested today to reach a retirement target without contributing another dollar
The Foundation Mistakes: Lessons 1 Through 7
The first seven errors cost the most in the earliest years of an investing career, often without the investor recognizing the damage until it has compounded for years.
Sequencing and Account Priority
According to the Vanguard How America Saves 2025 report, 86% of defined contribution plans offer an employer match, and the median match is 4% of salary. Directing money to a taxable brokerage before capturing that match forfeits the only guaranteed 100% return in investing. An investor contributing $5,000 per year in matched money for 20 years at a historical 7% return could accumulate approximately $205,000 in future value from that annuity alone — before purchasing a single share of any dividend ETF.
The Roth IRA contribution limit for 2026 is $7,500 for filers under age 50. Unused annual contribution room does not roll over — it is permanently forfeited. A $100,000 SCHD position in a taxable account yielding approximately 3.3% generates roughly $3,300 in qualified dividends per year. At the 15% qualified rate, that is approximately $495 in annual federal tax that a Roth account would eliminate entirely. Compounded at 7% over a decade, the tax drag accumulates into thousands of dollars of lost growth. Experienced investors fund their Roth on or near January 2 and leave it alone until the following January.
Overlapping ETFs, Emergency Reserves, and Dividend Tax Classification
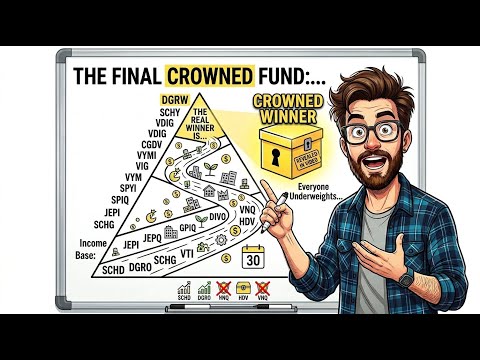
SCHD, DGRO, VYM, VIG, and NOBL all draw from roughly the same universe of large-cap U.S. dividend payers — Johnson & Johnson, Coca-Cola, Procter & Gamble, Home Depot, and PepsiCo among others. Owning all five creates concentration in the same underlying companies at a combined higher expense ratio, not diversification. The practical rule is to hold no more than two core dividend funds: one growth-oriented such as SCHG or DGRO, and one yield-oriented such as SCHD or VYM. The 4-ETF Dividend Ladder framework demonstrates how to structure income-focused holdings without redundant overlap.
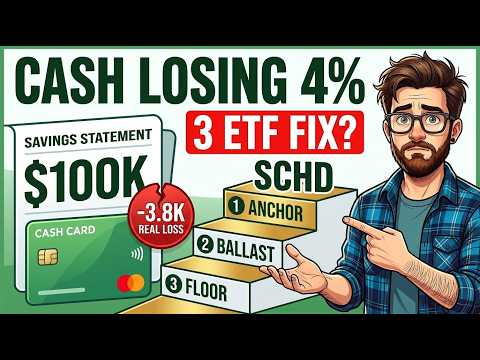
A six-month emergency reserve in a high-yield savings account, Treasury money market, or a short-duration fund like SGOV should be established before any equity investment. The S&P 500 dropped approximately 34% in 33 calendar days during March 2020 — the fastest bear market in modern U.S. history. Without a cash cushion, an investor facing any income disruption must choose between selling equities at a loss or carrying high-interest debt. The emergency fund is what makes every other lesson on this list survivable.
In 2025, qualified dividends were taxed at 0% for single filers with modified AGI below approximately $48,350, at 15% for most middle-income filers, and at 20% at higher levels. Ordinary income dividends are taxed at the full marginal rate, reaching 37% federally. SCHD, VYM, DGRO, NOBL, and VIG pay primarily qualified dividends. JEPI and JEPQ pay primarily ordinary income because their distributions come from equity-linked notes tied to covered call premiums. REITs and BDCs also generate ordinary income by default. A $100,000 JEPI position can owe roughly twice the federal tax of a comparable SCHD position based on dividend classification alone.
Panic Selling and the Case for Automated Investing
The DALBAR report identifies panic selling during downturns as the single largest driver of the investor performance gap. The S&P 500 rose approximately 68% off its March 23, 2020 low through year-end. An investor who sold a dividend portfolio at that low and waited until mid-May to re-enter — waiting for conditions to stabilize — locked in a permanent loss of approximately $7,500 and missed the majority of the recovery. According to DALBAR, the gap between the average equity investor and the index has persisted at several hundred basis points annually for decades. The only historically supported responses to a serious market decline are to continue buying on schedule or to hold without change.
Dollar-cost averaging — automating a fixed monthly contribution into a core ETF without monitoring the purchase price — removes the entry timing decision entirely. The consistency of buying over time matters more than the price on any single purchase date. Automatic contributions are boring, unsexy, and they almost always win.
Mid-Game Mistakes: Years Five Through Fifteen
With enough capital to feel confident, investors in the middle phase tend to make adjustments that quietly reduce long-term returns without appearing immediately harmful.
SCHD vs. SCHG and the JEPI Tax Location Error
As of May 2026, SCHG had a 10-year annualized total return of approximately 18.16%. SCHD's 10-year annualized return was approximately 11.19%. SCHG yields under 0.5%; SCHD yields around 3.3%. These are not competing funds — they serve different functions. A $100,000 investment in SCHG ten years ago could potentially be worth approximately $525,000 today, compared with approximately $290,000 for SCHD with dividends reinvested. In pure accumulation, weighting toward SCHG accelerates portfolio growth. In pre-retirement or distribution phases, heavier SCHD weighting provides more stable cash flow. The SCHD and SCHG 70/30 core satellite strategy maps this weighting shift across different life stages in detail.
JEPI generates roughly 7–8% in distribution yield by combining equity ownership with equity-linked notes that synthesize covered call premiums on the S&P 500. Per JPMorgan's own fact sheet, that premium income is classified as ordinary income — not qualified dividends. A $100,000 JEPI position in a taxable account at the 22% federal bracket generates approximately $1,500–$1,700 in annual federal income tax, plus applicable state tax. The same position inside a Roth IRA produces zero federal tax on those distributions. The location rule is straightforward: JEPI, JEPQ, DIVO, and SPYI belong in tax-advantaged accounts whenever possible. SCHD, VYM, and DGRO — which distribute qualified dividends — can sit comfortably in taxable accounts. Getting the location right can quietly recapture an entire percentage point of net return without taking on any new investment risk.
Yield Traps, Fund Mechanics, and Behavioral Costs
Sorting ETFs by yield without examining price return is the dividend yield trap Morningstar has documented for years. A fund yielding 7% with a 3–4% annual price decline delivers only 3–4% in total return — barely above inflation. Total return should always be evaluated before yield. SPYI, the NEOS S&P 500 High Income ETF, uses Section 1256 contracts and return of capital distributions that appear tax-efficient on the surface. However, return of capital reduces cost basis — it is tax-deferred, not tax-free — and creates a larger capital gain at eventual sale. Reviewing 19a-1 notices and year-end 1099 forms before building any significant position in a covered call fund is necessary diligence.
A 10–20% allocation to international dividend funds such as SCHY or VYMI provides inexpensive insurance against a potential reversal of U.S. equity dominance. International stocks materially outperformed U.S. equities during the 2000–2010 period; neither cycle has proven permanent. Checking a portfolio daily rather than quarterly amplifies what Benartzi and Thaler termed myopic loss aversion in their 1995 research — more frequent observation produces more emotional trading decisions. A quarterly review, an annual rebalance, and an end-of-year tax check is the appropriate cadence. Automating a raise directly into an investment account on the day a new paycheck arrives prevents lifestyle creep from absorbing the increase. The U.S. personal savings rate sat near 3.6% in early 2026, according to the Bureau of Economic Analysis, versus a historical average closer to 7–8%.
Late-Game Wisdom: Lessons 15 Through 20
The final six lessons address the decisions that determine whether a retirement portfolio survives its first decade of distributions intact.
NOBL's Defensive Tilt and Bond Fund Duration Risk
NOBL, the ProShares S&P 500 Dividend Aristocrats ETF, holds approximately 70 companies that have raised dividends for at least 25 consecutive years. Its largest sector exposures are consumer defensives at roughly 23.5%, industrials at about 20%, financial services around 12%, and basic materials around 11%. Technology is nearly absent because few tech companies carry a 25-year dividend increase streak. NOBL is a value and defensive tilt — it tends to lag growth-led markets for extended periods and holds up better during downturns. For a 30-year-old in pure accumulation, it is likely too defensive for the majority of the portfolio. For a retiree in distribution, that defensive posture is approximately what the fund was built for.
TLT, the iShares 20+ Year Treasury Bond ETF, posted a total return of approximately -31.4% in 2022 — worse than most equity bear markets in recent memory. The mechanism was duration: TLT carries an effective duration of roughly 17 years, meaning a one percentage point rise in long-term interest rates produces approximately a 17% price decline. Treasuries carry no credit risk, but duration is its own risk category. BND, the Vanguard Total Bond Market ETF, returned approximately -13% in 2022, while SGOV returned approximately 1.5–2% in the same period. BND has an effective duration of about six years; SGOV is functionally equivalent to cash yielding the federal funds rate. Treating BND as a cash substitute or emergency fund vehicle is a categorization error with material consequences for any retirement income plan.
Roth Conversion Windows and Sequence of Returns Risk
Under the SECURE 2.0 Act, required minimum distributions begin at age 73 for those born between 1951 and 1959, and at age 75 for those born in 1960 or later. The gap between retirement and RMD onset — often five to ten years — creates a period where taxable income is unusually low. A 65-year-old retiree living on $30,000 in annual cash savings with no Social Security claim and no RMDs could convert $50,000 from a traditional IRA to a Roth and owe approximately $5,000–$7,000 in federal tax. That money then grows tax-free and is exempt from future required distributions. Mapping the conversion window before retirement begins, with a fee-only fiduciary or CPA, is one of the highest-value tax planning steps available to pre-retirees.
The Trinity Study, in its most recent form through 2023 data, shows a 4% withdrawal rate on a 50/50 stocks-and-bonds portfolio succeeded in approximately 95% of all 30-year rolling periods. At 3%, success rates approach 100% across 30-, 40-, and 50-year horizons. At 5% over 30 years, the success rate drops to about 76%. The sequence of returns — whether major drawdowns arrive early or late in retirement — affects outcomes as much as the withdrawal rate itself. A cash and short-bond buffer of two to three years of expenses prevents forced equity sales during early-retirement downturns, preserving the compounding base over the long term.
The Coast FIRE Calculation
The Coast FIRE framework answers a specific question: how much does an investor need in the market today, at their current age, to reach a retirement target at a historical 7% real return without making any additional contributions? The formula fits on a napkin: Future Value = Present Value × (1.07)^years. At age 45 with $250,000 invested and 20 years remaining, $250,000 × (1.07)^20 ≈ $967,000 — nearly $1 million in today's purchasing power with no further contributions required.
Coast FIRE to $1 million at a 7% real return (Choose FI framework): approximately $175,000 at age 25 | $250,000 at age 30 | $350,000 at age 35 | $500,000 at age 40 | $625,000 at age 45 | $750,000 at age 50
Every dollar invested at age 45 is worth approximately $3.87 in real, inflation-adjusted terms by age 65. The Coast FIRE number is not a motivational concept — it is a precise threshold. Investors who know their number understand exactly how much further they need to go and when compounding can carry the remaining work without additional input. Running this calculation annually, alongside a standard portfolio review, is the single habit that ties all twenty lessons together. If the number has been reached, the next five lessons trending on financial social media do not really matter. If it has not, the path forward is clear.
Watch the Full Video Breakdown
For a complete visual walkthrough of all twenty lessons — including the exact account priority sequence, ETF location rules by fund type, the NOBL sector breakdown, and the Coast FIRE math applied across multiple starting ages — the full video on the Harry's Financial channel covers each topic with historical fund-level data that complements this article. The video runs approximately 40 minutes and is worth watching in full whether you are building a dividend portfolio from scratch or restructuring one that has drifted from its original plan.