- Key Takeaways
- What Is the Dividend Crossover Point?
- The Math Behind Your Personal Crossover Number
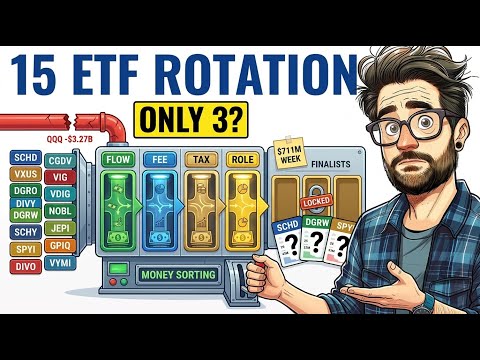
- The Three-ETF Engine That Powers the Crossover
- The Inflation Adjustment That Moves the Finish Line by $700,000
- Crossover vs. the 4% Rule, 25x Rule, and Coast FIRE
- Three Practical Accelerators That Shorten the Path
- Watch the Full Crossover Point Breakdown
There is a specific milestone in every dividend investor's journey that most retirement calculators never mention: the moment monthly passive income permanently overtakes monthly expenses. That milestone has a name — the Crossover Point — and understanding its math can fundamentally reshape how you approach financial independence.
Key Takeaways
- The Crossover Point is the moment monthly dividend income exceeds monthly expenses, making earned income optional
- SCHD's trailing yield of approximately 3.44% and ten-year annual dividend growth rate near 11% make it the core engine for driving the income line upward
- Your personal Crossover target is based on projected future expenses, not current spending — a distinction worth up to $700,000 in required capital
- DIVO (approximately 4.7% yield) accelerates income during the accumulation phase; VIG provides late-stage portfolio stability when it matters most
- Reinvesting every dividend (DRIP) is essential during the first 70% of the journey to Crossover
- The Crossover Point is a distinct — and later — milestone than Coast FIRE, and operates on fundamentally different logic than the 4% withdrawal rule
What Is the Dividend Crossover Point?
The Crossover Point was originally framed by Vicki Robin and Joe Dominguez in their landmark personal finance book Your Money or Your Life, published in the 1990s. The concept centers on a simple two-line graph. The first line represents monthly expenses — relatively flat or rising slowly with inflation. The second line represents monthly passive income — starting near zero and climbing over time through consistent investing. The day those two lines intersect is the Crossover: the moment earned income becomes optional and work is no longer a financial requirement.
Dividend investing is uniquely suited to this framework. Unlike a growth-only portfolio that produces a fluctuating paper net worth figure, a dividend ETF portfolio generates real, countable income that appears in brokerage statements every month. That visibility creates a measurable, psychologically reinforcing signal that the income line is actually rising. Investors who reach the Crossover are overwhelmingly those who could watch the numbers move — quarter by quarter, distribution by distribution — which is what separates those who stay the course from those who abandon the plan around year four.
The Math Behind Your Personal Crossover Number
The Bureau of Labor Statistics reported that the average American household spent approximately $78,000 in 2024, or roughly $6,500 per month. At SCHD's current trailing twelve-month yield of approximately 3.44%, replacing that level of spending requires approximately $2.28 million in dividend-producing capital. That figure discourages most people — but most people are not trying to fund average American spending.
A household with essential monthly expenses of $4,000 — a realistic figure for many mid-career families who have paid down significant debt — needs $48,000 in annual dividend income. At a 3.44% yield, the required portfolio drops to approximately $1.4 million. A couple with paid-off housing and controlled discretionary spending at $3,000 per month reaches Crossover at just over $1 million. A $1,500 monthly difference in projected expenses moves the finish line by hundreds of thousands of dollars in required capital. The Crossover is a personal calculation, not a universal number.
The Three-ETF Engine That Powers the Crossover
Reaching the Crossover efficiently requires addressing the distinct demands of each phase of the accumulation journey. A three-layer portfolio structure — SCHD at the core, DIVO as a mid-phase income amplifier, and VIG as late-stage ballast — provides a framework that adapts as the income line climbs.
SCHD: The Core Crossover Engine
SCHD's combination of a trailing yield near 3.44% and a ten-year annual dividend growth rate of approximately 11% makes it the most efficient single vehicle for compounding the income line upward. An ETF yielding 6% with zero dividend growth may appear more attractive initially. In practice, after seven or eight years, SCHD's compounding distributions overtake the static high-yielder in total dollars produced per share — and continue growing. The dividend growth rate, not the starting yield, determines long-term income trajectory. That distinction is central to the Crossover framework.
DIVO: The Bridge Accelerator
DIVO generates a distribution yield of approximately 4.7% through a covered call writing strategy that layers option premium income on top of underlying dividend income. The trade-off is reduced participation in strongly rising markets. For investors actively pushing toward the Crossover, allocating 20–30% of the portfolio to DIVO during the middle phase pulls monthly distributions meaningfully higher without abandoning the dividend thesis. DIVO functions as a bridge accelerator rather than a permanent core holding.
VIG: The Late-Stage Stabilizer
As the portfolio approaches the Crossover, capital preservation becomes as critical as income growth. VIG, which focuses on companies with ten or more consecutive years of dividend growth, historically demonstrates lower volatility and more stable price action than the broader market. A 15–20% VIG allocation in the final years before Crossover provides resilience at precisely the moment a major drawdown would be most damaging.
For a detailed look at how DIVO, VIG, and SCHD interact across a complete portfolio construction, the 4-ETF Dividend Ladder breakdown covers the fund mechanics in depth.
The Inflation Adjustment That Moves the Finish Line by $700,000
The most consequential error in Crossover planning is calculating the target against current spending. The correct calculation uses projected spending at the anticipated Crossover date, specifically accounting for expenses that will no longer exist by then.
A mortgage paid off by age 55 eliminates $1,000 to $2,000 per month from the required income total. Children leaving the household reduces expenses by $800 to $1,500 per month. College funding ending removes another significant variable. By the time most investors actually reach their Crossover year, their expense line has decreased — not increased — relative to peak earning years. Most retirement calculators miss this entirely.
At a 3.44% yield, a $2,000 monthly difference in projected expenses translates to roughly $700,000 less in required portfolio capital — the equivalent of years of compounding, saved by calculating against the right spending number.
To illustrate with a concrete case: a 42-year-old married investor with a current monthly spend of $6,200, a mortgage expiring in 12 years, and children expected to be financially independent by age 57, projects a future baseline expense of $4,000 per month. That yields a Crossover target of $48,000 in annual dividend income. With a current $350,000 portfolio split 60% SCHD and 40% VIG, generating roughly $9,450 in annual dividend income at a blended yield of approximately 2.7%, and monthly contributions of $2,000, the projected Crossover lands between ages 56 and 58 depending on market conditions. The path is specific and calculable.
Crossover vs. the 4% Rule, 25x Rule, and Coast FIRE
The Crossover Point is frequently conflated with other financial independence frameworks. The distinctions matter in practice.
The 4% rule and the 25x rule are withdrawal frameworks: they assume a retiree systematically sells portfolio shares each year to fund expenses. In a severe market downturn, a 4%-rule retiree sells depressed shares at the worst possible moment. A Crossover investor collects dividends that historically continue to grow through downturns — no forced share liquidation required. That behavioral difference compounds over decades. The investor who does not have to sell into a crash is far more likely to remain invested through it, and interrupting contributions even briefly demonstrates how costly that lost compounding becomes.
Coast FIRE is a different milestone. Coast FIRE is the point at which a portfolio is large enough that, with zero additional contributions, it will compound to a conventional retirement target by a standard retirement age. The Crossover Point is later and larger — it is the moment the portfolio already generates enough income to cover current living expenses. Most investors reach Coast FIRE five to ten years before Crossover. That window is when it becomes possible to downshift work intensity, transition to a lower-stress role, and allow the portfolio to finish the job without requiring maximum contribution rates.
Three Practical Accelerators That Shorten the Path
DRIP (Dividend Reinvestment Plan): Every dividend should be automatically reinvested until the portfolio reaches approximately 70% of the Crossover target. Before that threshold, reinvestment is the primary compounding engine. After 70%, dividends can begin accumulating in a money market account as a pre-retirement liquidity buffer.
Tax Location: Placing the highest-yielding funds — SCHD and DIVO — inside tax-advantaged accounts, preferably a Roth IRA, eliminates the recurring tax drag on distributions. Holding high-yield dividend funds in taxable accounts creates a compounding inefficiency that can amount to tens of thousands of dollars in missed growth over a 20-year horizon.
Automation: Automatic paycheck contributions, automatic dividend reinvestment, and annual automatic rebalancing remove human decision points from the process. Behavioral consistency — not investment selection skill — is the primary determinant of whether an investor reaches Crossover. Removing friction from the system protects against the most common failure mode: stopping contributions during periods of market stress.
Watch the Full Crossover Point Breakdown
The scenarios, portfolio calculations, and two-line convergence graphs described in this article are covered in detail in the YouTube video embedded above. The visual walkthrough makes it significantly easier to see how the income and expense lines converge under different contribution rates, yield assumptions, and spending projections — and to identify where your own Crossover date is likely to land. If you want to see the specific acceleration effect of adding DIVO to the middle phase, or the full dollar impact of the inflation-adjusted expense recalculation, watching the complete video is the fastest path to running those numbers for your own situation.