- Key Takeaways
- What the Decades Test Actually Measures
- The Old Guard: Five Funds That Lived Through the Global Financial Crisis
- The Crash-Tested Cohort: SCHD, SDOG, RDIV, and DGRO
- Modern Champions: SPYD, DJD, and DIVB
- The International Case: SCHY
- The Climactic Pick: NOBL and the Dividend Aristocrats
- Why Expense Ratios Are a 30-Year Decision
- Watch the Full Video Breakdown
Five major market crashes. Fourteen dividend ETFs. One question: did the dividend keep coming? That is the core of the Decades Test — a framework for evaluating dividend ETF durability not by current yield, but by survival across the worst market environments on record: Black Monday in 1987, the dot-com collapse from 2000 to 2002, the global financial crisis of 2007 to 2009, the COVID crash of March 2020, and the rate spike of 2022. The funds that passed this screen are the ones that paid through every one of those regimes — as actual funds or through underlying strategies with documented historical records. Yield is a snapshot. Survival is a story.
Key Takeaways
- The Decades Test filters dividend ETFs across five major drawdowns from 1987 to 2022, ranking survival above current yield.
- FVD, launched in August 2003, is the oldest dividend-focused ETF on this list and applies the proprietary Value Line Safety ranking system — a screen almost no other fund uses.
- VIG has compounded at approximately 13.18% annually over the past ten years; a $25,000 position with dividends reinvested a decade ago would be worth roughly $86,000 today.
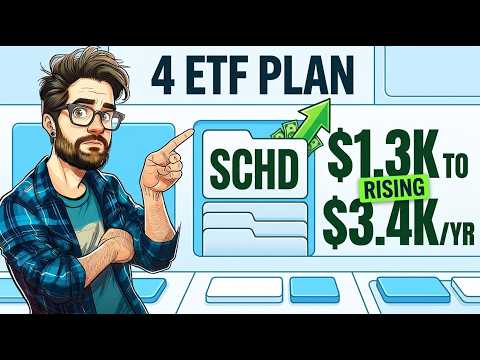
- SCHD's most expensive risk is behavioral — investors who sold during the 2022 drawdown were forced to repurchase at higher prices after the dividend continued rising.
- NOBL's underlying S&P 500 Dividend Aristocrats Index backtests to 1989 and includes companies like Procter & Gamble and Coca-Cola with more than 60 consecutive years of dividend growth.
- A 1% annual expense ratio versus 0.05% on a $100,000 investment compounded at 10% for 30 years produces a gap of nearly $400,000 in final portfolio value.
What the Decades Test Actually Measures
The Decades Test uses five specific market drawdowns as its filter. Black Monday in 1987, when the S&P 500 fell more than 31% peak to trough and dropped over 20% in a single trading session. The dot-com crash from 2000 to 2002, when the S&P fell roughly 47% and the NASDAQ fell 78%, taking approximately seven years to recover its prior high. The global financial crisis of 2007 to 2009, when the index lost 37% in calendar year 2008 alone and did not reclaim its prior high until 2013. The COVID crash of March 2020, when the market fell almost 34% in five weeks before recovering in five months. And the rate spike of 2022, when the S&P fell approximately 25% and took roughly 15 months to recover.
Any fund — or underlying strategy — that failed to survive at least four of those five events with dividends still rising on the other side did not make the cut. Several well-known names were excluded for methodology rewrites, bloated expense ratios, and aggressive yield screens that pull in companies on the edge of cutting. The funds that remain are the ones that were disciplined enough to keep doing the same thing across five different market regimes.
The Old Guard: Five Funds That Lived Through the Global Financial Crisis
FVD — First Trust Value Line Dividend Index Fund (launched August 2003) is the oldest dividend-focused ETF on this list. Unlike most modern funds that screen for yield or growth history, FVD starts with the Value Line Safety ranking system — in use since the 1960s — and selects stocks rated one or two for safety. From that pool, it picks companies with above-average dividend yields and equal-weights them. That equal weighting means a small consumer staples company carries the same portfolio weight as the largest industrial in the fund, producing a historically lower-volatility portfolio than a market-cap-weighted approach. FVD has paid a quarterly distribution every single quarter since inception: through the global financial crisis, the COVID shutdown, and the 2022 rate spike. The trade-off is a higher expense ratio than most modern dividend ETFs, which is the cost of the proprietary research system underneath it.
PEY — Invesco High Yield Equity Dividend Achievers Portfolio (launched late 2004) begins with the Dividend Achievers index, which requires at least ten consecutive years of dividend increases, and then selects the fifty highest yielders from that pool. The combination of long track record and high yield produces a more volatile fund than broadly diversified alternatives, with a historical tilt toward financials and utilities. That sector concentration explains why PEY behaves differently during rate cycles than a fund like SCHD. PEY survived the global financial crisis, COVID, and the 2022 rate spike with the dividend intact on the other side.
VIG — Vanguard Dividend Appreciation ETF (launched April 2006) tracks the S&P US Dividend Growers Index, which selects American companies with at least ten consecutive years of dividend increases and deliberately excludes the top 25% highest yielders to filter out yield traps. The fund holds approximately 330 companies, carries an expense ratio of four basis points, and has assets under management of roughly $102 billion. The trailing yield sits around 1.58%, lower by design because the methodology screens away the highest yielders. The historical ten-year total return has compounded at approximately 13.18% annually. A $25,000 investment made ten years ago with dividends reinvested would be worth approximately $86,000 today at that compound rate. VIG lived through the global financial crisis, COVID, and the 2022 rate spike as an actual fund, with dividends growing on the other side of each event.
VYM — Vanguard High Dividend Yield ETF (launched November 2006) takes the opposite approach from VIG. It tracks the FTSE High Dividend Yield Index, which selects American stocks expected to pay above-average yields and weights them by market capitalization, producing broad diversification — more than 550 holdings — with a noticeably higher current yield. VYM entered the back half of the global financial crisis as a real fund, and while the share price fell with the broader market, the underlying companies continued distributing income. For investors who prioritize current income with broad sector coverage without concentrating in a fifty or one-hundred-stock portfolio, VYM has been the foundational answer for nearly two decades.
HDV — iShares Core High Dividend ETF (launched March 2011) tracks the Morningstar Dividend Yield Focus Index, screening approximately 75 high-yielding US equities through Morningstar's quality framework, including the economic moat rating and financial health score. The result is a tilt toward energy and healthcare, which proved advantageous in 2020 when energy was selling off but healthcare was holding firm. HDV survived both COVID and the 2022 rate spike with dividend continuity intact. The 75-stock concentration introduces more volatility than VYM, but the quality screen does meaningful work filtering out yield traps.
The Crash-Tested Cohort: SCHD, SDOG, RDIV, and DGRO
SCHD — Schwab US Dividend Equity ETF (launched October 2011) tracks the Dow Jones US Dividend 100 Index, which runs one of the strictest screens in the industry. To qualify, a company must have paid a dividend for at least ten consecutive years and must pass additional screens on cash flow to debt, return on equity, dividend yield, and five-year dividend growth. Approximately 100 companies survive that filter from the entire US market. The expense ratio is six basis points, assets under management are approximately $89 billion, the trailing yield is roughly 3.39%, and the 30-day SEC yield has been running closer to 3.55%. The ten-year total return has compounded at approximately 11.6% annually. A $25,000 investment ten years ago with dividends reinvested would be worth approximately $75,000 today; a $50,000 investment, approximately $150,000.
SCHD did not exist for the global financial crisis, the dot-com crash, or Black Monday — a real caveat worth acknowledging. The more costly risk with SCHD is behavioral: investors who sold during the 2022 drawdown were forced to buy back at higher prices once the dividend resumed its growth trajectory. The methodology is not built for trading. It is built for a long-term holder who reinvests every quarterly distribution and lets the screen do the work. For a deeper look at how interrupting a dividend ETF strategy compounds into real losses, see Pausing Dividend ETFs for 6 Months: The $13,900 Mistake.
SDOG — ALPS Sector Dividend Dogs ETF (launched 2012) selects the five highest-yielding stocks from each of the ten S&P 500 sectors and equal-weights all fifty positions. The forced sector diversification means no single sector can dominate the fund, regardless of where the highest yields happen to cluster in any given quarter. In March 2020, a market-cap-weighted high-yield fund with 25% energy concentration absorbed the full force of oil's collapse. SDOG's energy allocation was locked at 10% — one sector out of ten. The same equal-sector discipline that cushions sector-specific drawdowns also limits upside when one sector is in a sustained multi-year run.
RDIV — Invesco S&P Ultra Dividend Revenue ETF (launched 2013) starts with the sixty highest-yielding stocks from the S&P 900, removes those with unsustainable payout ratios, and then weights the remaining names by revenue. Revenue weighting is unusual in dividend ETFs — most use market cap, yield, or equal weighting. Weighting by top-line sales tilts the portfolio toward companies producing real revenue rather than those managing their yield through financial engineering. RDIV survived both COVID and the 2022 rate spike with distributions continuing.
DGRO — iShares Core Dividend Growth ETF (launched June 2014) tracks the Morningstar US Dividend Growth Index, requiring at least five consecutive years of dividend growth, positive earnings growth expectations, and a payout ratio under 75%. The fund holds approximately 400 companies, carries an eight-basis-point expense ratio, and has approximately $34.6 billion in assets under management. The trailing yield is around 2.00%, with the 30-day SEC yield running closer to 2.14%. The ten-year total return has compounded at approximately 13% annually — a $25,000 investment a decade ago with dividends reinvested would be worth approximately $85,000 today. DGRO and SCHD answer different versions of the same question: SCHD asks which 100 companies have paid for at least a decade; DGRO asks which 400 companies have grown the dividend for at least five years. For a detailed side-by-side, see DGRO vs SCHD: The Dividend Growth Stall Investors Need to See.
Modern Champions: SPYD, DJD, and DIVB
SPYD — SPDR Portfolio S&P 500 High Dividend ETF (launched October 2015) selects the 80 highest-yielding stocks in the S&P 500 and equal-weights them at a seven-basis-point expense ratio — among the lowest in the high-yield category. The portfolio has historically concentrated in financials and real estate, the sectors that consistently produce the highest yields within the S&P. SPYD is suited to investors who want maximum current income at minimal cost and accept the rate-cycle volatility that a financials and real estate tilt introduces.
DJD — Invesco Dow Jones Industrial Average Dividend ETF (launched 2015) takes all 30 stocks in the Dow Jones Industrial Average — the oldest continuously calculated stock index in America, published since the 1890s — and weights them by dividend yield rather than by share price. The result is a yield-proportional slice of 30 large, established industrial and consumer leaders whose dividend track records span multiple generations. Procter & Gamble, Coca-Cola, and Johnson & Johnson have paid and raised dividends through periods that predate any ETF wrapper in existence. DJD survived COVID and the 2022 rate spike with the dividend continuing.
DIVB — iShares US Dividend and Buyback ETF (launched 2017) screens for companies that return cash through both dividends and share buybacks, treating total shareholder return — not dividend yield alone — as the primary signal. A company doing both is demonstrating capital discipline across two channels simultaneously. DIVB is the only fund on this list built on the combined-return framework, and it survived both COVID and the 2022 rate spike with distributions intact.
The International Case: SCHY
SCHY — Schwab International Dividend Equity ETF (launched 2019) applies a similar quality and dividend track record screen to non-US developed market companies, providing exposure to dividend payers across Europe, Japan, Switzerland, the United Kingdom, and other developed economies. Swiss consumer goods companies with multigenerational payout histories, Japanese industrials whose dividend discipline survived the entire lost decade, and European pharmaceutical companies with payout cultures predating the Second World War are all represented here.
The case for SCHY rests on a historical pattern: the US and international developed markets have traded performance leadership over multi-decade cycles. There were extended periods in the 2000s when international developed dividend payers outperformed their US counterparts on total return. A portfolio anchored entirely on the US side of that trade carries more concentration risk than most investors recognize. SCHY is the only fund on this list that addresses that concentration without leaving the dividend investing framework. The honest caveat is that the fund itself has not yet survived a full cycle of major crashes inside this exact wrapper — what it offers is a credible application of a proven quality framework applied outside US borders.
The Climactic Pick: NOBL and the Dividend Aristocrats
NOBL — ProShares S&P 500 Dividend Aristocrats ETF (launched October 2013) tracks the S&P 500 Dividend Aristocrats Index, which has one hard rule: a company must be a member of the S&P 500 and must have raised its dividend for at least 25 consecutive years. Fewer than 70 companies in the entire S&P 500 currently meet that bar. NOBL equal-weights all qualifying companies and rebalances quarterly. The expense ratio is 35 basis points — higher than the Vanguard and Schwab funds on this list, which is the cost of access to the strictest dividend screen on the market.
The reason NOBL closes this list is not the fund's twelve-year track record. It is the index. The S&P 500 Dividend Aristocrats Index has backtested data going back to 1989, covering four of the five drawdowns that define the Decades Test: the dot-com crash, the global financial crisis, COVID, and the 2022 rate spike. The companies inside the index extend the record even further. Procter & Gamble has raised its dividend for approximately 70 consecutive years. Genuine Parts, approximately 70. Coca-Cola, 64. Johnson & Johnson, 64. Colgate-Palmolive, Lowe's, and Emerson Electric anchor the same elite group. These are companies that paid through Black Monday in 1987, through the dot-com crash, through the financial crisis, through COVID, and through the rate spike of 2022.
The fund wrapper is twelve years old. The strategy inside it is generational. No other fund on this list combines a backtested index with constituent-level dividend histories this deep and this well documented. The screen is difficult to game — a 25-year consecutive increase requirement cannot be manufactured; it has to be earned one year at a time. Past survival does not guarantee future survival, but it is the most credible evidence available, and NOBL provides access to the deepest version of that evidence at a single, transparent expense ratio.
Why Expense Ratios Are a 30-Year Decision
The cost gap between cheap and expensive dividend ETFs compounds silently across decades. A $100,000 investment in a fund charging a 1% annual expense ratio, compounded at a 10% gross return for 30 years, produces a final portfolio value of approximately $1,327,000. The same $100,000 in a fund charging only 0.05% — five basis points — at the same gross return over the same period produces approximately $1,720,000. The expense ratio alone, with no other variable changed, accounts for a difference of nearly $400,000. That is why the cheapest funds on this list — VIG at four basis points, SCHD at six, SPYD at seven, DGRO at eight — quietly dominate the long-run conversation regardless of short-term yield comparisons. Compounding does not reward a single great year. It punishes annual drag, every year, for thirty years.
Watch the Full Video Breakdown
For a visual walkthrough of all fourteen funds — including side-by-side return data, yield comparisons, and the full reasoning behind each exclusion — watch The DECADES Test: 14 Dividend ETFs That Survived Every Crash Since 1985 on the Harry's Financial Fitness YouTube channel. The video covers the complete methodology in detail and is the fastest way to build a working mental model of dividend ETF durability before making any portfolio allocation decision. Reminder: this content is for educational purposes only and does not constitute financial advice. Past performance does not guarantee future results. Always conduct your own research before investing.