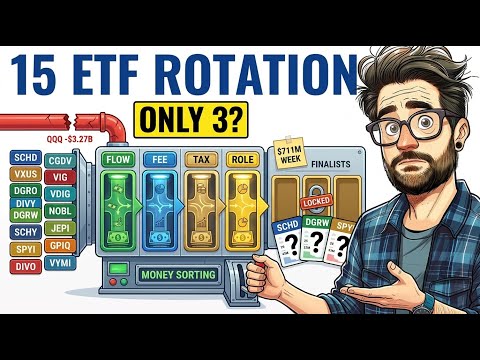
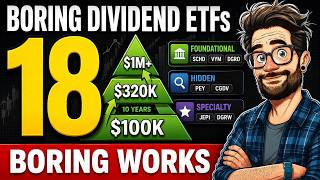
Twenty-four billion dollars poured into U.S. dividend ETFs in the first quarter of 2026 alone — the strongest first-quarter inflow in four years. While most investors were chasing AI stocks and momentum trades, a quieter group was buying eighteen specific, rules-based dividend ETFs and sitting on them. These are not exotic high-yield products promising twenty percent returns. They are transparent, low-cost funds with verifiable track records across full market cycles, and together they cover the entire dividend investing spectrum from foundational growth anchors to monthly income machines.
Reuters reported in late March 2026 that U.S. dividend funds pulled in roughly $24 billion in Q1 2026 — the strongest first-quarter inflow in four years. SCHD alone attracted approximately $4 billion of that total.
Key Takeaways
- $24 billion poured into U.S. dividend funds in Q1 2026, with SCHD attracting roughly $4 billion alone
- SCHD has delivered approximately 12.3% annualized total return over the last decade with dividends reinvested
- DGRW has historically outperformed SCHD by more than one full percentage point per year over ten years
- Covered call ETFs JEPI (~8.3% yield), JEPQ (~10.5% yield), and SPYI (~11.9% yield) generate monthly income by writing options against their underlying portfolios
- NOBL requires 25 consecutive years of dividend increases — every holding has survived recessions, oil shocks, and pandemics while continuing to raise its dividend each year
- A simple five-ETF blend of SCHD, DGRO, VIG, NOBL, and DGRW provides broad coverage at a blended expense ratio well under 20 basis points
The Foundational Six Dividend ETFs
These are the obvious starting points — cheap, broadly diversified, and collectively capable of forming the core of any serious retirement portfolio. Together they could reasonably make up sixty to eighty percent of a sensible long-term dividend strategy.
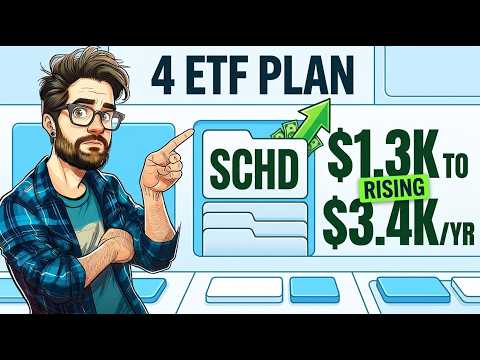
1. SCHD — Schwab U.S. Dividend Equity ETF
With roughly $86 billion in assets and an expense ratio of just six basis points, SCHD is the gravitational center of the dividend ETF universe. The fund holds approximately 100 quality dividend payers and has issued a quarterly dividend every quarter since its 2011 launch. The March 2026 payout of approximately $0.257 per share represented a 3.3% raise over the same quarter last year. Top holdings include UnitedHealth Group, Texas Instruments, Qualcomm, and Broadcom, with the sector mix weighted toward technology, healthcare, and financials. Over the last decade, SCHD has historically delivered around 12.3% annualized total return with dividends reinvested — enough to grow a $100,000 investment into roughly $320,000 without any active trading.
2. VYM — Vanguard High Dividend Yield ETF
VYM is Vanguard's answer to SCHD, built on a much wider base of over 600 large blue-chip dividend stocks. The expense ratio matches SCHD at six basis points, assets exceed $90 billion, and the trailing dividend yield is approximately 3.5%. With heavier exposure to financials and energy than SCHD, and no single holding exceeding about 6% of the fund, VYM is the broad alternative for investors who prefer more diversification than a 100-name portfolio provides.
3. DGRO — iShares Core Dividend Growth ETF
DGRO yields only about 2% today, but its dividends have grown at approximately 9.5% per year over the last five years — one of the highest dividend growth rates on this list. The expense ratio is eight basis points, assets are around $37 billion, and approximately 400 holdings include Broadcom, JPMorgan Chase, Apple, and Microsoft. DGRO and its sibling DGRW share a dividend growth philosophy but diverge meaningfully in screening methodology and long-term return. For a detailed comparison, see DGRO vs SCHD: The Dividend Growth Stall Investors Need to See.
4. VIG — Vanguard Dividend Appreciation ETF
VIG is the largest dividend growth ETF in the world at over $104 billion in assets. The yield is a modest 1.5%, but the expense ratio is just four basis points — the lowest on this list. Eligibility requires at least ten consecutive years of dividend increases, which automatically filters out most companies that have not survived a recession. Top holdings include Broadcom, Apple, Microsoft, JPMorgan, and Eli Lilly across 343 names. VIG has historically delivered approximately 10% annualized since inception, with a trailing twelve-month total return of approximately 21.5%.
5. NOBL — ProShares S&P 500 Dividend Aristocrats ETF
NOBL raises the consistency bar significantly higher. Every holding must have raised its dividend for at least 25 consecutive years, meaning the fund's roughly 70 stocks have proven their ability to keep paying through recessions, oil shocks, the dot-com bust, the 2008 financial crisis, and the pandemic. The yield is around 2.1%, the expense ratio is 0.35%, and assets are approximately $11 billion. Equal weighting across consumer defensive and industrial-heavy names gives NOBL a predictability that few other dividend strategies can match. Since inception, NOBL has historically returned approximately 10% annualized.
6. HDV — iShares Core High Dividend ETF
HDV screens for strong financial health and durable competitive advantages, then tilts toward the highest yielders within that filter. The expense ratio is eight basis points, assets are approximately $13.5 billion, and the fund holds 70 to 80 names. Top holdings are concentrated in energy — Exxon Mobil at over 8%, Chevron at over 6% — and healthcare, with Johnson & Johnson at approximately 5.5%. HDV is the defensive, high-yield complement for investors who already hold SCHD or VYM as a core position and want a sleeve that pays a higher current yield in virtually any macro environment.
The Hidden Six: Rules-Based Dividend ETFs Most Investors Overlook
These six ETFs attract a fraction of the attention that SCHD and VYM receive, but each runs a clear, transparent methodology that has been quietly compounding inside portfolios for years.
7. SCHY — Schwab International Dividend Equity ETF
SCHY takes the SCHD screening algorithm and points it at international markets outside the U.S. The yield is around 3.4%, the expense ratio is 14 basis points, and the fund holds about 100 names including Eni, TotalEnergies, and Allianz. As the U.S. dollar softened through 2025 and into 2026, international dividend ETFs like SCHY quietly outperformed their domestic counterparts. For American investors whose dividend portfolios are entirely U.S.-focused, SCHY adds international quality dividend exposure with a methodology they already recognize from SCHD.
8. PEY — Invesco High Yield Equity Dividend Achievers ETF
PEY has been sending dividend checks since 2004, making it one of the oldest high-yield factor ETFs on this list. It holds the 50 highest-yielding dividend achievers — companies with at least 10 years of consecutive dividend growth — rebalances annually, and pays distributions monthly. The expense ratio is 0.53%, assets are just over $1 billion, and top names include LyondellBasell, Robert Half, Eastman Chemical, and Target. For a retiree who wants smooth monthly cash flow without abandoning a dividend growth screen, PEY is one of the most underrated options on this entire list.
9. CGDV — Capital Group Dividend Value ETF
CGDV is the only actively managed ETF on this list, and it earns its spot. Capital Group has been managing money since 1931. When they brought their dividend value strategy to an ETF wrapper in 2022, the market responded unusually well: CGDV has grown to approximately $29.5 billion in assets in just over three years — a remarkably fast pace for an active strategy. The expense ratio is 0.33% — high for passive, very low for active management. About 50 concentrated holdings include Broadcom, NVIDIA, Microsoft, Philip Morris, and Exxon Mobil. CGDV is the choice for investors who want a high-conviction, actively managed dividend portfolio without paying mutual fund-era fees or sacrificing ETF tax efficiency.
10. RDIV — Invesco S&P Ultra Dividend Revenue ETF
RDIV screens for ultra-high-yielding stocks in the S&P 900 and weights them by company revenue rather than market cap — a deliberate mechanism to avoid yield traps where falling share prices artificially inflate apparent yields. The expense ratio is 0.39%, assets are just under $1 billion, and approximately 60 holdings include Chevron, Prudential Financial, AT&T, Clorox, and Public Storage. RDIV pairs naturally with a growth-tilted fund like DGRW as a portfolio barbell: DGRW for total return compounding, RDIV for current income.
11. DJD — Invesco Dow Jones Industrial Average Dividend ETF
DJD takes the 30 Dow Jones Industrial Average components and tilts the weighting toward the higher dividend yielders. The expense ratio is just seven basis points, assets are around $450 million, and top positions include Verizon at nearly 10%, UnitedHealth at over 7%, Chevron at nearly 7%, Merck at just under 5%, and Coca-Cola close behind. With only 30 holdings and a small asset base, DJD operates with precision on its mandate without the drift that comes from managing tens of billions across hundreds of names.
12. SDOG — ALPS Sector Dividend Dogs ETF
SDOG codifies the Dogs of the Dow concept into a rules-based ETF. The methodology picks the five highest-yielding stocks in each of the eleven S&P sectors, equally weights them, and rebalances once per year — then does nothing for the next twelve months. The expense ratio is 0.40%, assets are around $1.3 billion, and 50 holdings include Microchip Technology, Texas Instruments, Hewlett Packard Enterprise, Evergy, and Kenvue. Equal sector weighting prevents the financials-and-energy overconcentration that plagues most cap-weighted dividend ETFs.
The Specialty Toolbox: Covered Call ETFs and the Top Historical Pick
This final chapter covers income-tuning instruments designed to convert market exposure into monthly cash flow, plus the single ETF that has historically outperformed SCHD over both five and ten years on total return.
JEPI, JEPQ, DIVO, and SPYI: The Covered Call Income Quartet
JEPI (JPMorgan Equity Premium Income ETF) is the flagship covered call income ETF in the U.S. market, with approximately $45 billion in assets and a trailing yield of around 8.33%. JEPI owns a low-volatility slice of the S&P 500 and sells call options through equity-linked notes to generate monthly distributions. On a $25,000 investment at the current yield, JEPI could generate roughly $170 per month before taxes. The trade-off is upside participation — JEPI gives up meaningful price appreciation during strong market rallies in exchange for consistent monthly income.
JEPQ (JPMorgan Nasdaq Equity Premium Income ETF) uses the same playbook aimed at the Nasdaq 100. The trailing yield is approximately 10.5% (30-day yield closer to 12%), assets are around $37 billion, and the portfolio is concentrated in NVIDIA, Apple, Alphabet, Microsoft, and Amazon. JEPQ pays more than JEPI but rides the Nasdaq's larger swings. The practical framework: choose JEPI for steadier monthly income; choose JEPQ if you can tolerate more drawdown in exchange for a larger monthly check.
DIVO (Amplify CWP Enhanced Dividend Income ETF) occupies a practical middle ground between pure dividend ETFs and pure covered call ETFs. With approximately 30 to 35 concentrated holdings and selective call writing only when implied volatility makes it worthwhile, DIVO captures more upside in strong rally years than JEPI or JEPQ while still generating meaningful monthly income in the 4–6% yield range. The expense ratio is 0.55%, assets are around $6.5 billion, and top names include Caterpillar, Microsoft, Apple, American Express, and JPMorgan. For a practical retirement income framework combining DIVO with other dividend ETFs, see the 3-Bucket Dividend Strategy using DIVO, NOBL, and SCHD.
SPYI (NEOS S&P 500 High Income ETF), launched in August 2022, has already grown to over $9 billion in assets — one of the fastest-growing high-income ETFs in U.S. history. The trailing yield is approximately 11.9%, the expense ratio is 0.68%, and distributions are paid monthly across over 500 holdings that mirror the S&P 500. SPYI writes index options using SPX contracts that qualify for Section 1256 tax treatment — more favorable in a taxable brokerage account than the equity-linked note structure JEPI uses. General rule: SPYI belongs in a taxable account, JEPI belongs in a Roth IRA, DIVO works reasonably in either.
17. VYMI — Vanguard International High Dividend Yield ETF
VYMI applies the same Vanguard high-dividend methodology as VYM to over 1,500 international stocks across Europe, developed Asia, and emerging markets. The yield is approximately 3.5%, the expense ratio is 0.22%, and assets are around $19 billion. Top names include Novartis, HSBC, and Roche, with no single position exceeding approximately 1.5% of the fund. American dividend ETFs are heavily concentrated in U.S. financials, technology, and energy. VYMI's largest exposures are international financials, European healthcare, and global consumer staples — entirely different underlying companies with different economic drivers. When the U.S. market stalls, that international ballast can meaningfully cushion a domestic-only dividend portfolio.
18. DGRW — The Pick If You Only Own One
DGRW (WisdomTree U.S. Quality Dividend Growth ETF) has historically beaten SCHD over both five and ten years on total return, despite a lower starting yield and a higher fee. The trailing yield is approximately 1.7% (distribution yield closer to 2.5%), the expense ratio is 0.28%, and assets under management are around $16.5 billion across approximately 200 holdings. Top names include NVIDIA at nearly 8%, Apple at over 5.5%, and Microsoft at nearly 5%.
Over the last five years, DGRW has historically returned approximately 11.3% annualized vs. SCHD's approximately 8.0%. Over the last ten years, DGRW has returned approximately 13.5% per year vs. SCHD's approximately 12.25% per year.
Based on historical performance, $100,000 invested in DGRW ten years ago would have grown to approximately $360,000 — versus approximately $320,000 in SCHD. A $40,000 gap with no active trading required. The difference is entirely in methodology: DGRW screens for quality, profitability, and dividend growth; SCHD screens primarily for current yield with quality filters. Over a full decade, the growth and quality tilt has historically delivered more total return.
DGRW also pays monthly distributions, unlike SCHD's quarterly schedule — a meaningful practical advantage for retirees building a paycheck replacement strategy. The trade-offs are real: NVIDIA, Apple, and Microsoft together make up close to 20% of the fund, creating a technology overweight that hurts more than SCHD during megacap drawdowns. And the lower starting yield takes years to build to the income levels SCHD provides on day one. Investors who need income immediately will find SCHD more practical. Investors who can let the portfolio compound while waiting for the income stream to grow will find DGRW difficult to beat based on the last decade of live data.
Building a Simple Dividend Portfolio From These Funds
A five-ETF blend of SCHD, DGRO, VIG, NOBL, and DGRW covers hundreds of dividend-paying companies, carries a blended expense ratio well under 20 basis points, and captures both current yield and long-term dividend growth — including the top historical performer on this list. Based on historical data, that simple blend would have grown a $100,000 investment to approximately $170,000 over the last ten years while delivering a steadily growing income stream throughout, with no trading required.
Watch the Full Video Breakdown
For a visual walkthrough of all eighteen ETFs — including side-by-side performance charts, the complete DGRW vs. SCHD ten-year analysis, and the full covered call comparison — watch the complete video on the Harry's Financial Fitness YouTube channel. All three chapters are covered in sequence, with the climactic pick and its historical performance data revealed last.
This article is for educational purposes only and does not constitute personal financial advice. Past performance does not guarantee future results. Always conduct your own research and consult a qualified financial advisor before making investment decisions.