- Key Takeaways
- How the Blended Score Works
- The Pure Income Five: SCHD, VYM, DGRO, HDV, and NOBL
- Hybrid and Covered Call Funds: VIG, DIVO, JEPI, and JEPQ
- Specialty Funds and the Contrarian Pick: SPYI, DGRW, SCHY, VYMI, and VOO
- The Contrarian Answer: VOO Plus the Four Percent Rule
- Final Rankings and Four Rules From the Data
- Watch the Full Video Walkthrough
Every retirement forum online runs the same debate on repeat: SCHD for life, JEPI as the ultimate monthly paycheck, or whatever covered call fund just hit eleven percent. The headlines are tempting. The number that actually matters — what each fund puts in your pocket after taxes, with your principal accounted for, over ten years — almost never appears in the discussion.
This analysis runs that exact math. Starting with $100,000 per fund, age 65, a 22% federal bracket, and a 10-year horizon with no reinvestment, fourteen of the most discussed retirement ETFs in America are ranked by a single blended score: total after-tax cash received plus half the ending portfolio value at age 75. The result overturns the conventional yield-chasing ranking almost entirely.
Key Takeaways
- DGRW, yielding just 2.1% today, ranks #1 on the blended score with a projected ending portfolio near $302,000 — $50,000 more than SCHD.
- VOO plus the 4% rule ranks #2, delivering more after-tax income over 10 years than 10 of the 13 dedicated dividend ETFs.
- JEPI's 8.44% yield is taxed almost entirely as ordinary income — in a taxable brokerage account, the annual tax drag approaches $1,900 per year.
- SPYI's 11.8% headline includes a Return of Capital component that is not income; its projected ending balance of $83,000 is the lowest of all 14 funds.
- SCHY and VYMI belong in taxable accounts to capture the foreign tax credit; JEPI and JEPQ belong in a Roth IRA.
- Yield alone tells you almost nothing about what a retirement ETF will actually deliver between age 65 and 75.
How the Blended Score Works
Yield by itself is an incomplete metric. A fund paying 11% that steadily erodes your principal is a worse retirement tool than a fund paying 2% whose balance triples. The blended score resolves this by combining two figures: total after-tax cash income received over the decade, plus half the ending portfolio value at age 75. That formula rewards funds that both pay you today and preserve your wealth for year eleven onward.
Tax treatment drives much of the ranking. Qualified dividends are taxed at 15% in the 22% federal bracket. Options premium income from covered call ETFs is classified as ordinary income and taxed at 22% — how the IRS categorizes it. Foreign dividend funds face a withholding adjustment. For the VOO + 4% rule scenario, most withdrawals represent long-term capital gains at 15%, not ordinary income, a structural tax advantage that most dividend-only comparisons ignore.
Disclaimer: Nothing in this analysis is financial advice. Every projection is based on historical averages and hypothetical scenarios. Past performance does not guarantee future results. Please consult a qualified financial advisor before making any changes to your retirement income plan.
The Pure Income Five: SCHD, VYM, DGRO, HDV, and NOBL
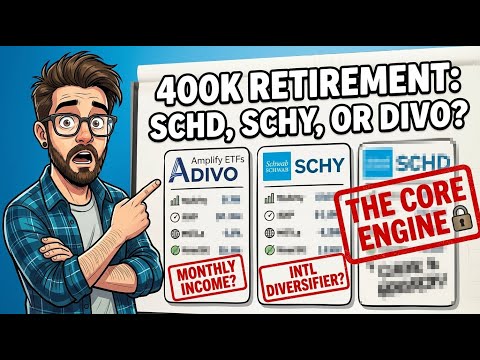
SCHD (Schwab U.S. Dividend Equity ETF) anchors more retirement portfolios than any other fund in the country — $90 billion in assets, a 6-basis-point expense ratio, and roughly 103 holdings. At a 3.34% trailing yield, it pays $3,340 per year gross on $100,000, or $2,839 after the 15% qualified dividend rate. With a historical 13% annual total return and a 7.3% five-year dividend growth rate, the projected 10-year after-tax income comes to roughly $39,785, with a potential ending portfolio near $253,000. Every other fund in this analysis is measured against that benchmark.
VYM (Vanguard High Dividend Yield ETF) offers broader diversification — over 600 holdings versus SCHD's 103 — at a 4-basis-point expense ratio. The trade-off is a lower 2.25% yield, producing about $1,912 after tax annually and roughly $25,000 in total 10-year after-tax income, with an ending value near $196,000. VYM's main case is overlap coverage: 86% of SCHD's holdings live inside it, making it a complementary satellite position rather than a primary anchor.
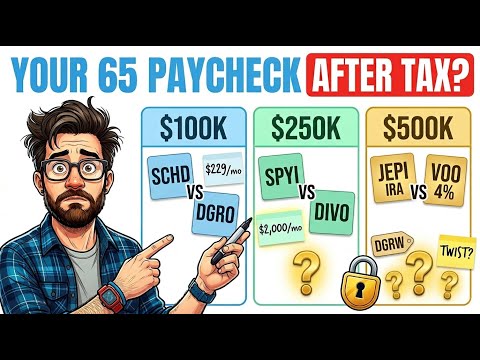
DGRO (iShares Core Dividend Growth ETF) screens for companies with at least five consecutive years of dividend increases and explicitly excludes the highest-yield names. Its 2.3% current yield produces about $1,955 after tax annually, with a projected 10-year after-tax income near $29,000 and an ending portfolio near $241,000. DGRO's distinguishing feature is an 8.5% historical dividend growth rate — faster than SCHD's 7.3% — meaning the per-share payout accelerates each year the growth streak holds. For a detailed look at how these two funds diverge over a full market cycle, see DGRO vs SCHD: The Dividend Growth Stall Investors Need to See.
HDV (iShares Core High Dividend ETF) pays the highest current yield of the pure income five at 2.9%, or about $2,465 after tax annually. But its 75-stock portfolio tilts heavily into energy and consumer staples — sectors that have historically compounded at roughly 8.5% annually versus SCHD's 13%. The projected ending value near $172,000 is the lowest of the five. The extra current yield in HDV signals slower underlying growth, and over a decade that gap compounds into a material wealth difference that is invisible on any yield screener.
NOBL (ProShares S&P 500 Dividend Aristocrats ETF) holds 68 companies — all with 25 or more consecutive years of dividend increases. That consistency premium costs a 35-basis-point expense ratio, nearly six times SCHD's, alongside a 2.2% yield producing about $1,870 after tax annually. The projected 10-year after-tax income is roughly $24,000 with an ending value near $222,000. NOBL's historical total return has trailed SCHD by approximately 2.5 percentage points annually over the past decade, making the elevated fee difficult to justify on the data alone, even though every name inside has raised its dividend through every recession since the 1980s.
Hybrid and Covered Call Funds: VIG, DIVO, JEPI, and JEPQ
VIG (Vanguard Dividend Appreciation ETF) is the largest dividend ETF on this list at $109 billion in assets and also the lowest-yielding fund in this chapter at 1.6%, producing roughly $1,360 after tax annually. Its distinguishing metric is a historical dividend growth rate of over 9% per year — the fastest of any fund in this analysis, and nearly double VYM's rate. The projected 10-year after-tax income comes to about $20,800, but the ending portfolio near $281,000 pushes VIG into the top five on the blended score. It is a dividend growth fund built for the payout ten years from now, not the check arriving this month.
DIVO (Amplify CWP Enhanced Dividend Income ETF) holds roughly 25 high-quality dividend stocks and writes covered calls on a portion of them each month, layering option premium on top of qualified dividends to push the total yield to 4.4%. After the blended tax treatment — dividends at 15%, options premium at 22% — the net after-tax annual income is approximately $3,617. The 10-year after-tax income stream lands near $48,000, with an ending value near $218,000. Held in a Roth IRA, the ordinary income portion avoids the higher rate entirely. For a broader framework on pairing DIVO with other funds, see the 3-Bucket Dividend Strategy: DIVO, NOBL & SCHD for Retirement.
JEPI (JPMorgan Equity Premium Income ETF) generates its 8.44% yield through equity-linked notes that write covered calls on S&P 500 stocks. On $100,000, that is $8,440 per year gross — but nearly all of it is taxed as ordinary income at 22%, reducing the after-tax take to $6,583 annually and creating a tax drag of nearly $1,900 per year compared to a fund paying qualified dividends at the same gross amount. The projected 10-year after-tax income is about $65,832, but the ending portfolio sits near only $97,600 — below the original investment. JEPI belongs in a Roth IRA, where the ordinary income classification becomes irrelevant. Placing it in a taxable brokerage account is one of the most common and costly account-location mistakes in retirement income planning.
JEPQ (JPMorgan Nasdaq Equity Premium Income ETF) mirrors JEPI's structure but concentrates on the Nasdaq 100, producing a 10.35% yield and roughly $8,073 after tax annually. The growth-stock tilt has historically allowed JEPQ to capture more upside in rising markets than JEPI, producing a projected 10-year after-tax income near $97,000 with an ending value near $118,000. Monthly distributions fluctuate with market volatility — 13 decreases and 22 increases over three years, because covered call premium is mechanically tied to implied volatility. Budgeting on the trailing yield in a brochure will produce a planning mismatch. The same Roth IRA location rule applies: roughly $1,500 of annual tax drag disappears in the right account, totaling approximately $15,000 over a decade.
Specialty Funds and the Contrarian Pick: SPYI, DGRW, SCHY, VYMI, and VOO
SPYI (NEOS S&P 500 High Income ETF) advertises an 11.8% yield — $11,800 per year on $100,000, paid monthly. Approximately half of that distribution has historically been classified as Return of Capital (ROC), which the IRS treats as a cost-basis reduction rather than taxable income, deferring — not eliminating — the eventual tax bill. The projection shows a 10-year after-tax income near $115,000, but the ending portfolio value at age 75 is only $83,000, the lowest of all 14 funds and $17,000 below the starting position. SPYI delivers the largest cash flow of any fund in this analysis and the most principal erosion. For a retiree with a hard 10-year horizon and substantial other assets, that trade-off may be acceptable. As a long-term anchor for a 30-year retirement, it is a slow-motion drawdown outcome.
DGRW (WisdomTree U.S. Quality Dividend Growth ETF) pays the smallest current income of the back half of this list at 2.1% — roughly $1,785 after tax annually — and ranks number one on the blended score. Its edge is total return: a historical 13.8% annual return over the past decade, the highest of any fund in this analysis. With a 7% historical dividend growth rate and monthly distributions, the 10-year after-tax income comes to roughly $25,000, while the ending portfolio reaches approximately $302,000. That is $50,000 more than SCHD, $60,000 more than DGRO, and more than $200,000 more than SPYI. DGRW rarely appears on high-yield screeners because sorting by income buries it at the bottom of the list — which is precisely why the total-return math works so strongly in its favor over a decade.
SCHY (Schwab International Dividend Equity ETF) holds roughly 200 developed-market international names with a 3.8% yield and approximately $3,230 after foreign tax withholding annually. The fund has been live only since October 2021, limiting its long-term track record. International dividend stocks have historically lagged U.S. equivalents over the past decade, and the projection reflects that: a 10-year after-tax income near $38,800 with an ending value near $150,000. SCHY's structural advantage is account location: in a taxable brokerage account, the foreign tax credit on IRS Form 1116 can recover most of the withholding. Inside an IRA, that credit is permanently forfeited.
VYMI (Vanguard International High Dividend Yield ETF) broadens the international dividend thesis to roughly 1,200 holdings and a 5.5% yield, producing about $4,675 after the foreign tax adjustment annually and a 10-year after-tax income near $57,400 — comfortably above SCHD's take-home cash. The ending value near $118,000 reflects slower international price appreciation. For a retiree already heavily weighted in U.S. large caps, VYMI offers genuine geographic diversification with a higher income stream, subject to the same taxable-account placement requirement as SCHY.
The Contrarian Answer: VOO Plus the Four Percent Rule
VOO (Vanguard S&P 500 ETF) pays a 1.2% dividend — roughly $1,020 after tax annually at a 3-basis-point expense ratio. No retirement income screener lists it as an income fund. That is the point of including it as the fourteenth pick.
William Bengen's 1994 research in the Journal of Financial Planning tested every rolling 30-year retirement window from 1926 forward. He found that a retiree withdrawing 4% of the initial portfolio in year one — and increasing that dollar amount by inflation each subsequent year — could potentially sustain withdrawals through every historical 30-year retirement period. The 1998 Trinity Study confirmed roughly a 96% success rate for an all-stock portfolio over the same horizon.
Starting with $100,000 in VOO, a first-year withdrawal of $4,000 adjusted upward by 2.7% annually for inflation produces approximately $45,227 in total withdrawals over 10 years. After the 15% long-term capital gains rate, the after-tax take is roughly $39,800 — higher than DGRO, NOBL, and VYM, and nearly level with SCHD, which paid a 3.34% dividend the entire period.
The ending portfolio value after 10 years of inflation-adjusted withdrawals sits near $260,000 — more than SCHD, DIVO, JEPI, JEPQ, SPYI, NOBL, VYM, HDV, VYMI, or SCHY. Only DGRW and VIG end with more, and VIG paid far less income along the way. The psychological barrier is real: selling shares feels like spending a nest egg while receiving a dividend feels like getting paid. The after-tax outcome is often identical or better with systematic selling. Two cautions apply: the 4% rule was designed for a 30-year horizon, not 40 or 50 years — a 3.5% initial rate is historically more appropriate for a 65-year-old who may live to 95. And the rule's success rate applies only when followed mechanically; discretionary increases based on spending impulse break the math.
Final Rankings and Four Rules From the Data
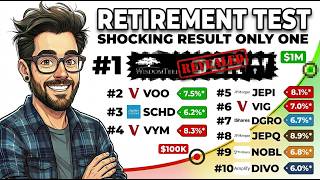
The blended score top five — DGRW, VOO + 4% rule, VOO dividends-only, SCHD, VIG — is a list no yield screener would ever generate. The covered call funds finish sixth through eighth because the cash they pay is offset by principal that quietly exits the portfolio. Four rules emerge from ranking all 14:
- Anchor in high blended-score funds: SCHD, DGRW, VIG, and the VOO + 4% rule form the historically efficient core of a retirement income portfolio.
- Covered call funds belong in a Roth IRA: JEPI and JEPQ shed $1,500–$1,900 per year of tax drag the moment they move to the right account — roughly $15,000–$19,000 over a decade.
- International funds belong in taxable accounts: SCHY and VYMI in a taxable brokerage allow the foreign tax credit to offset withholding. Inside any IRA, that credit is gone permanently.
- Return of Capital is not income: A fund distributing ROC is returning your own principal and labeling it a payment. The ending balance is the honest measure of what the fund actually delivered.
Watch the Full Video Walkthrough
The complete ranking — including detailed projections for all 14 funds, the exact blended score calculations, and year-by-year income trajectories — is covered in the video 14 HONEST Retirement ETFs — What They Actually Pay at 65 on the Harry's Financial Fitness YouTube channel. Watch it at