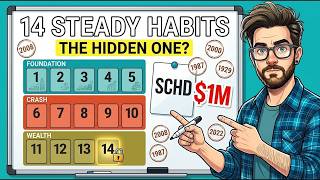
Twenty years of dividend investing across five market crashes — the dot-com unwind, 2008, 2020, and 2022 — reveals a consistent pattern. The investors who finished ahead were rarely the most sophisticated. They were the steadiest. They repeated a handful of unglamorous behaviors through every downturn while others panicked, sold, and reset from scratch. The gap is measurable: in one recent year, the average equity investor earned approximately 16.5% while the market itself returned just over 25%. That 8-point deficit was not caused by bad funds. It was caused by behavior. Stretched across 20 years, that behavioral drag compounds into roughly $1 million of difference on a $1 million portfolio. Same funds. Same market. Different habits.
The framework that explains the gap is the Steady Stack — fourteen habits grouped into three tiers: five foundational habits, five crash habits, and four wealth habits. Funds like SCHD, VIG, and DGRO appear throughout as examples only. The behavior beneath them is the point.
Key Takeaways
- Reinvested dividends accounted for 84% of the market's total return from the 1960s through 2021, making dividend reinvestment the single largest driver of long-run wealth.
- The average investor trailed the market by more than 8 percentage points in a single year — not from poor fund selection, but from behavioral mistakes during volatility.
- Dividend Aristocrats — companies with 25 or more consecutive years of dividend increases — maintained payouts through both the 2008 financial crisis and the 2020 crash.
- A fee gap of just 0.29% between two comparable funds removes approximately $13,000 from a $100,000 position over 20 years through compounding drag alone.
- $10,000 invested in the broad market in 1960 grew to roughly $796,000 without reinvestment and to nearly $4.95 million with all dividends reinvested.
- A written investment plan created before a crash arrives is the single most effective tool for staying invested through the recovery.
The Behavior Gap: Why Most Investors Trail Their Own Funds
The most counterintuitive finding in long-term dividend research is also the most consistent: investors systematically underperform the very funds they own. A widely cited study of investor behavior found that in one recent year, investors pulled money out of stock funds in every single quarter — with the largest outflows arriving just before the market's biggest gains. They did not miss the recovery by accident. They actively fled from it, in real time, while it was unfolding in front of them.
That behavioral pattern — selling near lows, moving to cash, and waiting for an all-clear signal that never rings a bell — is the entire source of the 8-point annual gap. Over 20 years at one percentage point of annual underperformance, that drag erases approximately $1 million on a $1 million portfolio. The fourteen habits in the Steady Stack exist to close that gap one behavior at a time.
The Foundational Five Habits (1–5)
These are the behaviors established at the outset and largely left unchanged. None of them are interesting in the moment. All of them carry the heaviest load across two decades.
Habit 1: Start Now and Automate Every Buy
The most expensive decision in investing is the year spent waiting. Research consistently shows that the average investor trails the market by more than one full percentage point annually, and nearly all of that gap originates not from poor fund selection but from hesitation — contributions skipped when headlines turned scary, entry points waited for that never arrived, months of caution that quietly became years.
The disciplined fix is automation: setting a monthly transfer to fire on the same date, with no exceptions, removes the emotional variable entirely. An investor who automates never needs to summon courage on a brutal Monday morning, because the buy was already scheduled by a calmer version of themselves. The hidden cost of pausing even briefly is explored in Pausing Dividend ETFs for 6 Months: The $13,900 Mistake — most investors significantly underestimate the compounding damage of a short interruption.
Habit 2: Choose Dividend Growers Over Pure High Yield
There are two kinds of dividend funds: those that pay a large yield today, and those that pay a smaller yield and raise it year after year. Over 20 years, the grower almost always wins. The approximately 69 companies that qualify as Dividend Aristocrats — defined as 25 or more consecutive years of dividend increases — maintained their payouts through the 2008 financial crisis and through the 2020 crash. That 25-year streak is a brutal filter. It quietly eliminates fragile companies long before they ever have to cut. Funds built around growers, such as VIG or DGRO, do not chase the loudest yield in the room. They select for a proven track record of raises that already survived the two worst markets in living memory.
Habit 3: Keep Costs Pinned to the Floor
Fee differences that appear trivial in isolation compound into real money over decades. A fund like SCHD charges approximately 0.06% annually — six cents on every $100. A fund like NOBL charges approximately 0.35%. On a $100,000 position, the annual difference runs about $290 — easily dismissed as pocket change. Over 20 years, however, the compounding effect of that gap removes approximately $13,000. Every dollar lost to fees is also a dollar that never gets to reinvest. Low cost and high total return are not separate habits. They are the same habit measured at two different finish lines.
Habit 4: Reinvest Every Dividend Until the Income Is Actually Needed
From the 1960s through 2021, reinvested dividends accounted for 84% of the market's total return. Price appreciation was the smaller chapter of the story. The dividends, paid out and immediately reinvested into more shares, were the engine of the whole thing.
An investor contributing $1,000 per month for 20 years at a 10% price-only return, taking dividends as cash, ends near $687,000. With dividend reinvestment switched on — pushing total return to roughly 12.5% — the same monthly contribution grows to approximately $916,000. Reinvestment alone adds more than $229,000 to the result from flipping one switch at the start.
In the accumulation phase, dividends are not a reward to spend. They are raw fuel for the snowball. Every dollar reinvested buys a fraction of a new share, and that fraction pays its own dividend, which buys another fraction, compounding forward in a chain that runs for decades. The rule is straightforward: leave it undisturbed until the income is genuinely needed.
Habit 5: Diversify Across Sectors, Not Just Fund Names
Owning four funds that each hold the same ten companies is not diversification — it is the same bet wearing four different labels. Real protection comes from owning businesses spread across genuinely different industries so that no single sector going dark can sink the entire income stream. In the 2020 crash, dividend cuts spread far more broadly across sectors than they had in 2008. Industries that appeared bulletproof suddenly faced pressure. The portfolios that kept paying their owners through it were the ones spread wide enough that one bleak corner of the market could not drag the rest down with it.
The Five Crash Habits (6–10)
These behaviors are only tested when markets break — which is precisely why almost nobody practices them until it is far too late.
Habit 6: Size Positions So No Single Name Can Wreck the Portfolio
Sector diversification is the first layer of protection. Position sizing is the second. No single company should be allowed to grow large enough that a dividend cut or a bad earnings call constitutes a personal catastrophe. Many long-term investors apply a ceiling near 5% per company. When a winner grows past that line, they trim it back and spread the proceeds across the rest of the portfolio. Trimming a winner feels wrong in the moment. Over 20 years, it guarantees that no single name ever takes a devastating bite out of total income — and that discipline, repeated across decades and crashes, is one of the most durable structural edges available to a dividend investor.
Habit 7: Hold Through the Crash
This is the behavior gap at its most visible, and breaking it is the single most expensive mistake a dividend investor can make. Investors who sold near the bottom and moved to cash missed the recovery while waiting for conditions to feel safe again. The fund earned its full return. Its owners did not, because they were not in the seat when the rebound came. Holding through is not comfortable — watching a portfolio fall 30% in weeks is genuinely difficult — but doing nothing on the worst day is the entire difference between the return the fund delivered and the much smaller return most real investors actually took home.
Habit 8: Keep Buying When It Feels Most Dangerous
Holding is the floor. Continuing to buy during a downturn is the ceiling. In the 2022 downturn, the broad market fell approximately 18%. SCHD fell roughly 9%. VIG fell roughly 6.5%. Dividend-focused funds not only held up better than the overall market — they handed the calm buyer a chance to accumulate more shares at a meaningful discount while panic was at its peak. Consider two investors entering the 2020 crash with $100,000: one holds and keeps automatic buys running; the other sells near the low and re-enters six months later. Five years out, the investor who stayed could be near $187,000. The one who sold and re-entered late could be near $90,000 — a gap of almost $100,000 from one behavioral difference during one scary month.
Habit 9: Avoid the Yield Trap
A yield is the dividend divided by the share price. When a company's stock collapses, the yield can spike sharply — not because the dividend became more generous, but because the price fell and the math went haywire. A real-world example: one company's yield ballooned past 18% after its stock had already fallen approximately 70%. That headline yield was not an opportunity. It was the wreckage of a business in freefall, and buyers who chased the income received the loss instead. A practical framework: yields of 2–6% on established companies are generally sustainable. From 6–10%, examine the payout ratio carefully. Above 10%, treat the yield as a trap until the business fundamentals prove otherwise.
Habit 10: Match Each Fund to the Right Account for Tax Efficiency
Qualified dividends — paid by most large U.S. companies and broad dividend ETFs — are taxed at lower long-term capital gains rates. Ordinary dividends, common from REITs and certain other income vehicles, are taxed at regular income rates. Placing income-heavy, tax-inefficient holdings inside a tax-advantaged retirement account shields them from the annual tax drag. For 2026, a married couple filing jointly can receive qualified dividend income up to approximately $99,000 of taxable income at a 0% federal rate. This account-location decision, made once at setup, quietly saves money every April for decades without any further effort.
The Four Wealth Habits (11–14)
These are the behaviors that compound in total silence over ten and twenty years. Getting any one of them wrong can negate everything else on the list.
Habit 11: Judge Every Fund by Total Return, Not Headline Yield
A yield is only half the story — and usually the smaller half. What an investor actually keeps is total return: dividends plus price growth, combined. SCHD has historically delivered around 12.6% annually since 2011, despite an average yield under 3% across that stretch. The yield was the visible, comfortable portion. The price growth underneath it was the larger, quieter engine. A fund yielding 9% with a slowly declining share price may deliver a fraction of that figure in actual total return. A fund yielding 3% whose payout and price both climb steadily can hand back double-digit total returns over a decade. The headline yield is a starting point for analysis, never a conclusion.
Habit 12: Let the Snowball Compound Without Interruption
This is Habit 4 at full scale. $10,000 invested in the broad market in 1960, with dividends spent as cash and only price growth counted, would have grown to approximately $796,000 by recent years. With every dividend reinvested — buying more shares, which paid more dividends, which bought still more shares — that same $10,000 grows to nearly $4.95 million. Same starting amount. Same market. The only difference was the snowball.
The snowball only compounds uninterrupted if the investor leaves it completely alone. Every panic sale, every restless reallocation chips a piece off the compounding chain and forces it to restart uphill. The investor who wins this habit checks the balance roughly once a year and ignores everything in between.
Habit 13: Track Income, Not Share Price
Most investors open their portfolio app and check one number: the total balance. In a crash, that number can fall 30% in weeks, making panic feel rational. The steadier habit is to watch the income — the actual dollars landing in the account — instead. In most downturns, dividend income barely moves even while prices fall sharply. The Dividend Aristocrats kept paying through both 2008 and 2020. An investor whose attention is trained on an unchanged income stream has a fundamentally different emotional experience than one watching a balance bleed lower every morning.
An investor who has built $800,000 in a dividend fund yielding 3% receives roughly $24,000 per year in income. When a crash hits and the balance falls, the $24,000 keeps arriving on schedule — because the underlying businesses are still selling products and issuing dividends. The price is an opinion set by millions of nervous traders every minute. The dividend is a fact. Training attention on the income rather than the price tag removes the primary trigger for panic selling and makes every crash habit on this list far easier to execute in practice. For a closer look at the income milestone that makes this shift feel real, see Dividend Crossover Point: When Passive Income Replaces Your Salary.
Habit 14: Write the Plan Down and Never Touch It During a Crash
This is the habit that makes the other thirteen possible. A major study found that in one recent year, investors pulled money out of stock funds in every single quarter — with the largest withdrawals arriving just before the market's biggest gains. They did not miss the recovery by accident. They ran from it in real time while it was happening, driven by fear and the absence of a written commitment to stay the course. That behavioral pattern, repeated by millions of investors, is precisely what creates and sustains the behavior gap across decades.
The solution is disarmingly simple: before any crash arrives, on a calm ordinary day, write down what you own, why you own it, and exactly what you will do when the market drops 30% — which for nearly every long-term dividend investor is nothing. Written commitments are followed far more reliably than vague intentions, because in the actual moment of panic there is no decision left to agonize over. The decision was made in advance, in writing, by a calmer version of the investor who already knew a crash was eventually coming.
When the crash hits, the investor with a written plan does not open the trading screen. They open the document. They read their own handwriting reminding them that this day was expected, that income is still arriving on schedule, and that the only required action is to do nothing and leave the automatic buy running. That non-decision — repeated across five crashes and twenty years — is worth more to the final outcome than any individual fund selection made across the same period.
Watch the Full Video Walkthrough
For a visual breakdown of all fourteen habits in the Steady Stack — including the exact data behind each proof point and how they apply across five real market crashes — watch the full video on the Harry's Financial Fitness YouTube channel.
Watch: 20 Years of Dividend Investing — The Steady Habits That Won →
The Common Thread Across All 14 Habits
Not one of these habits required predicting a crash, uncovering a secret fund, or timing a single entry point. Every behavior that did real heavy lifting over 20 years was, at its core, a habit of restraint and repetition. Automate and never stop. Choose growers over yield traps. Keep costs low. Reinvest and leave it alone. Diversify across real sectors. Hold through fear. Buy more when it hurts. Match accounts for taxes. Judge by total return. Let the snowball run undisturbed. Track the income, not the price. Write the plan down and honor it when it matters most.
SCHD, VIG, and DGRO were the vehicles. The discipline was the driver. And the driver is the only part of the equation any investor actually controls.
This article is for educational purposes only and does not constitute financial advice. All figures are drawn from historical data, which makes no guarantees about future performance. Always conduct your own research before making any investment decisions.