- Key Takeaways
- Why Most Retirement Projections Get It Wrong
- The Three Tests Every Dividend Retirement Must Pass
- Group 1: The Income Floor — High Yield Today, Hidden Costs Tomorrow
- Group 2: The Survivors — Dividends That Held Through Real Crises
- Group 3: The Lasting Few — Low Yields Today, High Income in Year 30
- The Lasting Mix: A Four-ETF Blueprint for 30 Years
- Where High-Yield Funds Fall Behind
- Watch the Full Video Breakdown
Most retirement calculators answer the same question: how much does a dividend portfolio pay on day one? The harder question — whether it still pays on day 10,950 — is almost never modeled. Running twelve dividend ETFs through a full thirty-year retirement stress test reveals a clear pattern: the funds that pay the most today almost always grow the least, and the ones that seem underwhelming at the start quietly build the largest income over time.
Key Takeaways
- Sequence-of-returns risk — not average return — is the primary factor determining whether a $500,000 dividend portfolio lasts 30 years.
- High-yield funds like JEPI and SPYI pay the most in year one but barely grow, losing real purchasing power to inflation over three decades.
- SCHD raised its dividend by nearly 18% during a 34% market crash in 2020, clearing both the sequence and durability tests simultaneously.
- A four-ETF "Lasting Mix" (SCHD, DGRO, VIG, DGRW) could grow $17,500 in year-one income to over $130,000 by year 30 from a $500,000 starting balance.
- The crossover point where a dividend-growth mix surpasses high-yield funds in annual income typically arrives around year 12 or 13.
- International dividend ETFs like VYMI returned more than 33% in a single year, offering a meaningful hedge when U.S. markets stall.
Why Most Retirement Projections Get It Wrong
The 4% rule, introduced by researcher Bill Bengen in the 1990s, established that a retiree withdrawing 4% annually from a balanced portfolio — adjusted for inflation — never ran out of money across any thirty-year period in history. But a dividend strategy operates differently. Instead of selling shares to fund living expenses, a dividend investor lives on the cash the portfolio generates and leaves the principal untouched. That single distinction is what makes long-term income growth possible — and what makes the sequence of market returns the most dangerous variable in the entire plan.
Consider two retirees, each starting with $1,000,000, averaging 6% annually for 30 years, and withdrawing $40,000 per year. The first retiree experiences a 37% crash in year one. After the withdrawal, the balance falls to roughly $590,000. Every future gain now compounds off that permanently smaller base. The second retiree hits the same crash in year twenty, after nineteen years of compounding have already done their work. Same average return. Same withdrawals. One portfolio runs dry years before the other. This is why two identical $500,000 dividend retirements can end so differently — and it is the central risk that high-yield ETF rankings never capture.
The Three Tests Every Dividend Retirement Must Pass
Each of the twelve funds in this analysis is measured against three criteria. Test 1 — Sequence: What happens if the market crashes in year one, when selling shares is the most damaging action a retiree can take? Test 2 — Durability: Does the dividend hold when companies are under pressure, or does income get cut exactly when it is needed most? Test 3 — Growth: Does income rise faster than inflation, or does it slowly lose real value while the statement number stays the same? In 2008 and 2009, dividends across the broad market were cut by roughly 20% — right as many investors were entering retirement. The funds that passed these tests have documented records from that period and from the 2020 crash that followed.
Group 1: The Income Floor — High Yield Today, Hidden Costs Tomorrow
JEPI (JPMorgan Equity Premium Income ETF) yields approximately 8%, paid monthly, with an expense ratio of 0.35%. It holds lower-volatility stocks and sells covered call options to generate income. When the market fell roughly 19% in 2022, JEPI's distributions held steadier than the index — a real advantage for retirees who need cash immediately. The catch: those same options cap upside when markets rally. JEPI significantly underperformed dividend-growth funds during 2023 and 2024. On a $500,000 starting balance, JEPI pays roughly $40,000 in year one. The income barely grows from there, which becomes the problem that only shows up over time.
SPYI writes options on the S&P 500 itself, advertising yields exceeding 8–9% monthly. A portion of its distribution may be a return of capital rather than earned income. That structure can be tax-efficient inside a taxable brokerage account because returned capital typically is not taxed in the year received. But tax-efficient and lasting are not the same thing. A distribution that quietly returns portions of the investor's own principal shrinks the balance that is supposed to keep paying for decades.
DIVO concentrates roughly 25 blue-chip names — the Apples, Microsofts, and Visas of the market — and writes covered calls selectively. Its yield sits around 5.25%, with the highest expense ratio in this group at 0.55%. The quality of its underlying companies allowed DIVO to recover faster than lower-grade high-yield funds after the 2020 crash. Quality of holdings determines recovery speed — a pattern that reappears in every fund that lasts in this analysis.
HDV yields 2.9–3.5% but concentrates roughly 37% of the entire portfolio in just two sectors: energy and healthcare. When energy dividends were broadly cut in 2020, funds structured like HDV felt it directly in income. Concentrated sector bets rarely complete a thirty-year run without at least one serious interruption, making them a fragile foundation for a multi-decade dividend retirement strategy.
Group 2: The Survivors — Dividends That Held Through Real Crises
SCHY applies Schwab's quality dividend screen to non-U.S. companies, yielding around 4.25–4.5% at a cost of just 0.14%. The fund is relatively young and lacks a decade-long track record, but it provides something no U.S.-only fund can: when the dollar weakens, foreign dividend income grows in real terms at the exact moment domestic purchasing power shrinks. That is an underappreciated hedge for a long retirement and one of the most cost-effective forms of currency diversification available.
VYMI (Vanguard International High Dividend Yield ETF) produced the single strongest total return in this entire twelve-fund lineup — more than 33% over the twelve months ending in June. It yields approximately 4.3%, paid quarterly. That return comes with exposure to emerging markets, meaning real currency volatility and geopolitical risk ride alongside the income. For a retiree whose entire portfolio tends to move in the same direction during every U.S. market panic, that kind of geographic balance is worth more than a half a percent of extra yield from a domestic fund.
NOBL holds only companies that have raised their dividend for at least 25 consecutive years — through the 2001 recession, the 2008 financial crisis, and the 2020 crash. Every holding carries that track record by definition. The yield is modest at roughly 2%, with an expense ratio of 0.35%. NOBL does not offer the highest income, but it offers evidence: unbroken dividend raises under every economic regime of the last quarter century. For a retiree who remembers watching dividends get slashed in 2008 and who cannot afford a repeat, that track record is more valuable than a higher headline yield.
VYM spreads income across more than 400 dividend payers at an expense ratio of just 0.06%. It held its payout straight through both 2008 and 2020 without flinching. One important caveat: VYM overlaps with SCHD by more than 80% of holdings in some analyses, so pairing them adds significantly less diversification than the holding count implies. With four hundred names, no single company's bad year ever defines a retirement year — that protection through sheer dilution is the real argument for VYM.
Group 3: The Lasting Few — Low Yields Today, High Income in Year 30
SCHD is the foundation of this analysis and the most important fund in the entire lineup. It screens for companies with at least 10 consecutive years of dividend payments and strong balance sheets, weights by quality rather than market size, yields approximately 3.5%, and charges just 0.06% annually. Over the past decade it has grown its dividend at roughly 11% per year. The defining data point: in 2020, while the S&P 500 fell 34%, SCHD did not cut its payout. It raised it — by nearly 18%, from $1.72 per share to $2.03. Income went up while prices fell off a cliff. That is test one and test two passed at the same time.
At a conservative 7% annual dividend growth rate on a $500,000 starting balance: year-one income of approximately $17,500 grows to roughly $34,000 by year 10, approximately $68,000 by year 20, and roughly $133,000 by year 30. At 3% inflation, the starting income only needs to reach $43,000 by year 30 to maintain real purchasing power. At $133,000, the income does not merely survive — it runs into a surplus.
DGRO holds more than 400 companies and enforces a rule SCHD does not: no company qualifies if it pays out more than 75% of its earnings as dividends. That payout cap forces businesses to retain enough cash to reinvest in their own growth, which keeps the dividend growing year after year. A company stretching to pay out everything it earns is a dividend cut waiting to happen. DGRO is built to never hold those companies. It has historically grown its payout 8–10% annually, yields around 2%, and costs 0.08%. Where SCHD's roughly 100 names may lag in any given sector cycle, DGRO's 400 holdings quietly pick up the slack — they function as partners, not rivals. For a closer look at how these two funds interact across different market cycles, see DGRO vs SCHD: The Dividend Growth Stall Investors Need to See.
VIG (Vanguard Dividend Appreciation ETF) admits only companies with at least 10 consecutive years of rising dividends, at the lowest expense ratio of any major dividend fund: 0.04%. Its yield of roughly 1.5% is the smallest in this group — the exact reason most investors scroll past it. Over the one-year period ending in May, VIG returned nearly 19%, the strongest total return of the growth trio. To be included in VIG, a company must have already proven it can last. That membership requirement is not a clever marketing screen; it is a documented filter for survival.
VIG also illustrates why living on dividend income outperforms selling shares in a down market. A retiree who sells shares after a 30% portfolio drop locks in a permanent loss: the balance falls to $350,000, $20,000 worth of shares is sold to cover living expenses, and the remaining $330,000 needs a 43% gain just to return to the starting point — while shares continue to be liquidated at depressed prices each year. A dividend investor holding quality growers through the same crash sells nothing. The dividend covers most living costs, a one-year cash reserve handles the remainder, and every share bought at the original price is still working when the recovery arrives. No shares sold at the bottom means no permanent loss locked in.
DGRW (WisdomTree U.S. Quality Dividend Growth Fund) closes the group by solving a practical problem most retirement spreadsheets ignore: most retirees pay bills monthly, not quarterly. DGRW distributes income every single month and weights companies by actual earnings rather than yield, at an expense ratio of 0.28%. It converts a dividend-growth strategy into cash flow that arrives on the same schedule as a mortgage payment or grocery run — without sacrificing the growth engine that makes the whole plan last three decades. As explored in the guide to building a 4-ETF Dividend Ladder, combining monthly and quarterly payers is one of the most practical steps a long-term dividend retiree can take.
The Lasting Mix: A Four-ETF Blueprint for 30 Years
Every test in this analysis points to one specific allocation for a $500,000 retirement portfolio:
- 50% SCHD ($250,000) — the core growth engine
- 20% DGRO ($100,000) — breadth and payout-cap discipline
- 15% VIG ($75,000) — crash-floor quality
- 15% DGRW ($75,000) — monthly income bridge
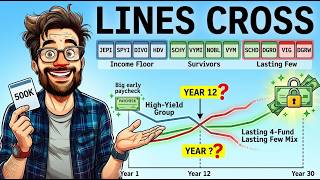
Year-one income from this blend: approximately $17,500, a 3.5% starting yield. Less than JEPI would have paid on day one. But at a historical growth rate near 7% annually, that income reaches approximately $24,000 by year five, $34,000 by year ten, $67,000 by year twenty, and $130,000–$145,000 by year thirty — all without adding new capital. Because no shares are sold and dividends are taken as cash, the $500,000 starting balance could reach several million dollars in market value by year 30 based on the historical returns of these four funds.
Even in a worst-case scenario where the market crashes 30% in the first year of retirement, the Lasting Mix holds. Dividend income barely moves — as SCHD demonstrated by raising its payout nearly 18% during the 2020 crash — while a one-year cash reserve covers any shortfall. No shares are sold at the bottom. The investor who panics and sells locks in the loss permanently. The dividend investor waits, because the paycheck makes waiting possible. The biggest single slice of the portfolio, SCHD's $250,000, starts generating roughly $8,000 in income on its own in year one, and at SCHD's historical growth rate that single position alone could be paying past $60,000 annually by year 30.
Where High-Yield Funds Fall Behind
JEPI and SPYI would have paid approximately $40,000 in year one from a $500,000 starting balance — more than double the Lasting Mix's opening income. That head start is real in the short term and should not be dismissed. But income that barely grows over 25 years, while inflation runs at 3%, loses roughly half its real purchasing power. A flat $40,000 annual check in year 25 is worth approximately $20,000 in today's dollars. The statement number stays the same. The life it funds quietly shrinks.
Because the Lasting Mix's income grows at roughly 7% annually while high-yield fund income stays roughly flat, the two lines cross somewhere around year 12 or 13. From that crossover point forward, the dividend-growth portfolio pays more every single year, and the gap widens for the rest of the retirement. A money market fund at current short-term rates generates roughly 4% on $500,000, or approximately $20,000 annually, with near-zero risk — a rational position for one to two years. But money market yields follow central bank rate cuts downward, as they did toward zero in 2020, and the principal never grows. $500,000 in cash is still $500,000 in thirty years, steadily eroded by inflation. A dividend-growth portfolio's principal, over the same stretch, has historically climbed past $1,000,000. Cash protects for a year. A growing dividend is built to protect for thirty.
Watch the Full Video Breakdown
For a visual walkthrough of all twelve funds — including year-by-year income projections, the crossover chart showing exactly where growing dividends surpass high-yield distributions, and the complete thirty-year model — watch the full breakdown on YouTube: Will $500,000 in Dividends Last 30 Years? I Modeled 12 ETFs. The sequence-of-returns risk curves and dividend growth comparisons are significantly easier to follow in visual format, and the video covers the crash scenario in real-dollar detail.
Disclaimer: This article is for educational purposes only and does not constitute financial advice. All projections are based on historical performance, which does not guarantee future results. Taxes, individual timelines, and personal circumstances vary. Consult a qualified financial advisor before making any investment decisions.