- Key Takeaways
- Why Dividend Growth Outperforms High Yield Over Time
- SCHD: The Foundation Underneath the Plan
- The Four Funds and the Role Each One Plays
- The Raise Calendar: Why Staggering Matters
- What $100,000 Could Look Like Over Ten Years
- Rising vs. Reaching: The Honest Long-Term Trade-Off
- Watch the Full Video Walkthrough
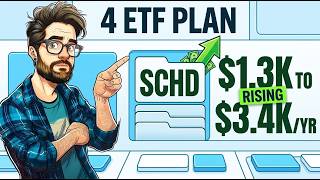
One of the most widely-held dividend funds on the market recently raised its payout by nearly 14 percent in a single quarter — not from a leveraged bet or an options scheme, but from the compounding business earnings that form the backbone of long-term wealth. That result points toward a deliberate strategy: building an entire portfolio engineered to deliver a raise every year, systematically, regardless of market conditions. This article breaks down a four-ETF dividend growth portfolio — SCHG, VIG, DGRO, and DGRW — designed to stack on top of an SCHD foundation and grow your income on a rising trajectory for the next decade and beyond.
Key Takeaways
- A $100,000 even split across four dividend growth ETFs starts at roughly $1,300 per year (1.3% yield) but could reach approximately $3,400 per year by year ten through raises alone — a 164% income gain with no new money added.
- DGRW raises its dividend at approximately 12.4% per year — the fastest of any fund in this plan — and pays distributions every month, 12 checks per year.
- VIG screens for companies that have raised dividends for at least 10 consecutive years; DGRO has raised for 11 straight years in a row.
- The staggered payment calendar means a raise event lands in nearly every quarter and a check arrives every single month via DGRW.
- A flat 4.5% yield fund is overtaken by this rising portfolio around year 13; by year 20, the rising plan pays nearly double.
- Yield on cost reaches approximately 3.4% on original capital after 10 years — competitive with what SCHD yields today — and is still accelerating.
Why Dividend Growth Outperforms High Yield Over Time
Most dividend investors evaluate a fund by the yield displayed today. A fund paying 4.5% appears to beat one paying 1.3% by a wide margin, and in year one, that judgment is entirely correct. The problem is what happens in years two through twenty.
A yield that never grows loses purchasing power to inflation every year. The investor collecting a flat $4,500 annually on a $100,000 position collects the same nominal dollars a decade later, while the cost of living has moved steadily upward. Dividend growth investing offers the opposite outcome: a lower starting yield that raises itself automatically, compounding each year, until it surpasses and then dramatically outpaces the static payout. Understanding the dividend crossover point — the moment a growing income catches a flat one — is essential for evaluating any dividend growth strategy over a realistic time horizon.
This four-fund plan is built entirely around that idea. Each ETF was chosen because it carries a documented history of raising its payout, and because each one raises on a slightly different schedule — a structural feature that turns the combined portfolio into a raise engine firing throughout the entire calendar year.
SCHD: The Foundation Underneath the Plan
Before introducing the four funds, it helps to establish what anchors the overall portfolio. SCHD — the Schwab US Dividend Equity ETF — serves as the bedrock. With a current yield of approximately 3.3% and a historical dividend growth rate of 9-10% per year over nearly a decade, it provides the income base the four-fund plan is designed to accelerate, not replace. Investors who already hold SCHD can add these four funds on top as an acceleration suite. Those starting fresh can treat SCHD as the launch pad and the four growers as the engine mounted above it.
The Four Funds and the Role Each One Plays
Each fund in this portfolio plays a specific role. The selection logic is not yield maximization — it is raise durability and raise speed, distributed across a calendar that puts income events in nearly every quarter of the year.
SCHG — The Growth Engine
The Schwab US Large Cap Growth ETF carries a current yield of only about 0.4%, which looks like a counterintuitive inclusion in an income plan. The rationale becomes clear on a longer time horizon. SCHG holds the fastest-growing large-cap companies in the US market — Microsoft, Apple, Nvidia, and Alphabet among them — and as those companies compound their earnings, many begin raising their own dividends. The dollar amount SCHG distributes grows over time even when the yield percentage on screen stays low.
Over the past 10 years, SCHG has delivered historical annual returns of approximately 18-19% with dividends reinvested. A $25,000 position currently generates about $107 per year, but if the underlying dividend dollars grow at 8-10% annually in line with large-cap earnings history, that same untouched position could pay $200-$250 per year a decade out — before counting any price appreciation. Its expense ratio is just $0.04 per $100 invested. SCHG represents capital today and income tomorrow. For more on pairing a growth ETF with a dividend anchor, see this breakdown of the SCHD and SCHG core satellite strategy.
VIG — The Reliable Raiser
The Vanguard Dividend Appreciation ETF holds only companies that have raised their dividend every single year for at least 10 consecutive years. To qualify, a company must have raised its payout through recessions, interest rate cycles, and inflation shocks — without ever once cutting. The result is a portfolio of more than 100 companies with audited, public raise histories spanning a full decade or longer.
VIG currently yields approximately 1.5%, costs $0.04 per $100, manages over $100 billion in assets, and has historically grown its dividend at roughly 7% annually over the long run. At that rate, the Rule of 72 puts the income-doubling timeline at just over 10 years — purely from raises, with no new capital required. Note that VIG's dividend appeared to dip slightly in the most recent single year due to a calendar timing quirk in how a prior payment landed, not a structural cut. The multi-year growth trend remains approximately 7% annually. Critically, the companies inside VIG proved through the 2020 and 2022 market downturns that they protect their raise streaks during price declines — because maintaining the streak is core to their corporate identity. When prices fall, the paycheck from these companies typically keeps climbing.
DGRO — The Bridge
The iShares Core Dividend Growth ETF positions itself between VIG's steady patience and SCHD's higher current yield, earning it the role of portfolio bridge. DGRO currently yields approximately 2%, costs $0.08 per $100, and has raised its dividend for 11 consecutive years — clearing VIG's 10-year requirement and continuing past it. It also carries a built-in safety filter: the fund will not hold companies paying more than 75% of their earnings as dividends, eliminating the payouts most at risk of being cut when earnings soften.
DGRO's historical total return of approximately 13-14% annually over the past decade stands among the strongest of any fund in this group. It begins contributing meaningful spendable income within the first two to three years of holding, while still growing the capital base underneath. It raises faster than VIG, yields more than SCHG, and bridges the gap between growth investing and income investing without forcing a choice between the two. For investors who need some income early but still want genuine long-term wealth-building potential, DGRO is often the most balanced single choice among the four.
DGRW — The Engine That Pays Monthly
The WisdomTree US Quality Dividend Growth ETF is the most distinctive fund in the plan. It screens for companies with strong earnings growth, high returns on equity, and a documented history of growing dividends — then pays distributions every single month, 12 times per year instead of the standard quarterly cadence.
Its headline metric: over the last five years, DGRW has grown its dividend at approximately 12.4% per year — the fastest rate in this portfolio by a wide margin. At that growth rate, the Rule of 72 places the income-doubling timeline at under six years. A $25,000 position starting at $320 per year could, based on that historical rate, be paying over $1,000 per year a decade out — a rise of more than 200% from that one fund alone. DGRW's monthly payments can fluctuate significantly from month to month due to how WisdomTree spreads variable annual income unevenly across the calendar; the figure that matters is the annual trend, which reflects that roughly 12.4% yearly growth. Its expense ratio is $0.28 per $100, the highest of the four, but that cost is purchasing the fastest raise engine in the lineup plus a monthly income cadence backed by a quality earnings screen — one that selects companies growing their actual business, not simply stretching their payout ratio until it breaks.
The highest yield available today is almost never the highest income tomorrow.
The Raise Calendar: Why Staggering Matters
The four-fund structure does more than diversify across dividend growers. It creates a staggered income and raise calendar that generates income events throughout the year without requiring any investor action.
- SCHD (foundation) pays quarterly; its annual raise typically arrives early in the year.
- VIG pays quarterly; raises generally land in spring quarters.
- DGRO pays quarterly on a separate cycle, distributing raise events at different calendar points.
- DGRW pays monthly — 12 checks per year — with annual raise growth embedded in the trend.
The combined result: nearly every quarter, at least one fund is at or near a raise event. Every month, DGRW delivers a payment. By year-end, an investor holding all four has received well over a dozen separate income deposits, with the annual total higher than the prior year — and no trades, no timing, and no decisions were required to make it happen. The calendar does the work.
What $100,000 Could Look Like Over Ten Years
Building this plan with $100,000 divided evenly — $25,000 into each fund — produces the following approximate starting income:
- SCHG: ~$107/year
- VIG: ~$367/year
- DGRO: ~$500/year
- DGRW: ~$320/year
- Total: ~$1,300/year (~$108/month, ~1.3% starting yield)
When each fund raises at its historical rate — SCHG at ~8%, VIG at ~7%, DGRO at ~11%, DGRW at ~12.4% — with no new money added, the income trajectory over ten years looks like this:
- Year 1: ~$1,300/year
- Year 3: ~$1,600–$1,700/year
- Year 5: ~$2,100/year (~$174/month) — approximately 60% above year one
- Year 7: ~$2,500+/year
- Year 10: ~$3,400/year (~$285/month) — approximately 164% above year one
By year 10, the yield on original cost reaches approximately 3.4% — competitive with what SCHD currently yields — while still accelerating. This is yield on cost in practice: a portfolio started at 1-2% yield can, through compounding raises, arrive at the income output of a high-yield fund and then continue climbing past it. Investors who reinvest every distribution rather than spending it will accelerate these figures further, buying additional shares that receive the same annual raises and turning a staircase into a snowball.
All projections are based on historical dividend growth rates. Past performance does not guarantee future results.
Rising vs. Reaching: The Honest Long-Term Trade-Off
Placing this strategy directly against a static high-yield alternative makes the trade-off concrete. Two investors each start with $100,000 on the same day. Investor A buys a fund yielding 4.5% with no dividend growth, collecting $4,500 per year — flat, permanently. Investor B builds this four-fund rising plan at a 1.3% starting yield, growing at a blended ~10% annually.
For the first 13 years, Investor A collects more income — often three to four times more in the early years. That is a genuine trade-off, not a rounding error. For anyone in or very near retirement who needs immediate cash flow, the high-yield starting point can be the right decision. But for investors with a decade or more before full income is needed, the math shifts decisively. Around year 13, the growing income crosses the flat income. By year 20, the rising plan pays approximately $8,700 per year while the flat payer remains at $4,500 — nearly double, and still rising every year after that.
The decision this strategy asks investors to make is simple to state and genuinely difficult to act on: the most income today, or a paycheck that raises itself every year for the life of the portfolio. The right answer depends entirely on your timeline and current income needs — but for investors building over a long horizon, the compounding argument is difficult to set aside.
Watch the Full Video Walkthrough
For a complete visual breakdown of all four funds, the raise calendar mapped month by month, and the year-by-year income projections laid out in detail, watch the full video on the Harry's Financial Fitness YouTube channel: My 4-ETF Dividend Plan for a RISING Paycheck Every Year. The video also walks through the crossover moment between rising and reaching income, and how reinvestment changes the ten-year outcome significantly.
Disclaimer: This content is for educational purposes only and does not constitute financial advice. All figures are based on historical performance. Past performance does not guarantee future results. Always conduct your own research before making investment decisions.