- Key Takeaways
- The REAL Thirty: Three Phases, Eighteen Stages
- Phase One: The Contribution Years (Years 1–10)
- Phase Two: The Compounding Decade (Years 11–20)
- Phase Three: The Income Years (Years 21–30)
- Stage 18: The Decision That Does Most of the Work
- Contribution Scenarios: How Long Does It Take?
- Watch the Full 40-Minute Video Walkthrough
Five thousand dollars a month. Sixty thousand dollars a year. Arriving in a brokerage account on a predictable schedule, independent of market direction, news cycles, or economic sentiment. The REAL Thirty is a structured, eighteen-stage, thirty-year dividend retirement plan built entirely around publicly traded, brand-name dividend ETFs available in any brokerage account today.
The framework requires no options strategies, no leverage, and no private placements. It maps a working investor's full thirty-year arc across three phases and eighteen deliberate stages, progressing from a $500-a-month auto-investment in year one to a five-figure monthly dividend paycheck by year thirty. All projections use data from issuer pages, Morningstar, and stockanalysis.com as of May 2026, with every forward estimate assuming historical dividend growth and total return rates continue.
Key Takeaways
- Automating a $500/month contribution from day one eliminates the single largest source of retail investor underperformance — a behavioral gap Dalbar measured at 848 basis points in a recent year.
- The dividend crossover point arrives around year 12, when reinvested dividends (~$555/month on a $200,000 SCHD position) begin exceeding fresh monthly contributions of $500.
- JEPI held in a taxable account at the top federal bracket loses approximately 24 cents per dollar to ordinary income tax drag; it belongs in a Roth IRA or 401(k).
- By year 25, original SCHD shares may yield 30–53% of their original purchase price annually, depending on which historical growth rate continues.
- The most important decision across all eighteen stages is maintaining the dividend growth core — SCHD, DGRO, and VYM — not chasing the highest current yield.
- A 4% blended yield on a $1.5 million portfolio produces exactly $5,000 per month in dividend income.
The REAL Thirty: Three Phases, Eighteen Stages
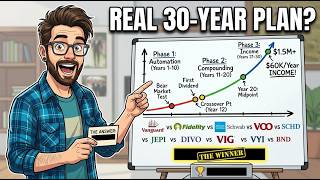
The framework divides a thirty-year investment arc into three distinct phases. Phase One: The Contribution Years (years one through ten) is where small numbers and slow progress test discipline before compounding has had time to visibly accelerate. Phase Two: The Compounding Decade (years eleven through twenty) is where the portfolio generates its own second growth engine through reinvested dividends. Phase Three: The Income Years (years twenty-one through thirty) is where accumulated capital converts into a sustainable, inflation-beating monthly paycheck.
The eighteen stages correspond to specific junctures where the plan either locks in or quietly fails — not because of the wrong fund selection, but because of the wrong behavioral decision at a pivotal moment. Each stage is small by design. The damage almost always happens between stages, when investors interrupt the process.
Phase One: The Contribution Years (Years 1–10)
Most investors lose the long game during Phase One. Dollar amounts feel unimpressive for years, and no external validation arrives to confirm the plan is working. The objective across years one through ten is to make the contribution automatic, treat short-term market noise as irrelevant, and celebrate small milestones before they compound into large ones.
Stage 1 (Year 1) establishes the foundation: open a brokerage at Schwab, Fidelity, or Vanguard, then set a monthly auto-investment of $500. The Dalbar Quantitative Analysis of Investor Behavior found that the average equity investor earned 16.54% in the year the S&P 500 returned 25.02% — a behavioral gap of 848 basis points, the second-largest in a decade, driven almost entirely by poorly timed withdrawals. Automation closes that gap by removing the human decision from every market wobble. If you have ever paused contributions at the wrong moment, the analysis in Pausing Dividend ETFs for 6 Months: The $13,900 Mistake quantifies exactly what that decision costs in real dollar terms.
Stage 2 (Year 2) delivers the first dividend — approximately $79.92 for the year, or roughly $20 per quarter. The dollar amount is trivial; the behavioral shift is not. Research suggests investors who receive a first dividend payment are dramatically more likely to continue contributing through the following decade. A $20 quarterly deposit is the first time the plan touches a bank account instead of sitting on a screen.
Stage 3 (Year 3) brings the first market correction. SCHD declined just 3.26% in total return terms in 2022 — the worst equity bear market since 2008 — while its dividend continued to grow. Across all fourteen full calendar years of its existence, SCHD has finished in positive total return territory in twelve. A declining market during the contribution phase is arithmetically beneficial: the same fixed $500 buys more shares, which produce more dividends, which compound into more shares at a lower cost basis.
Stage 5 (Year 7) introduces the dividend growth tilt. With the portfolio at approximately $60,000–$70,000, new contributions can begin shifting toward dividend growth ETFs. SCHD carries a 3.33% trailing yield, a 0.06% expense ratio (six cents per year on every $100 invested), a five-year dividend CAGR of 9.2%, and a ten-year dividend growth rate of 11.5%. VOO anchors capital appreciation with a 15.34% five-year annualized return through 2026. DGRO offers a lower yield near 2% but a ten-year total return of approximately 12.9%. A gentle tilt at year seven — 70% VOO, 30% SCHD — plants dividend growth seeds early enough to allow full compounding before income draws begin.
Stage 6 (Year 10) closes Phase One. At $500/month into a 9% blended annual return over ten years, the portfolio reaches approximately $96,000. At $1,000/month, the figure approaches $193,000. Cumulative dividends reinvested across the decade total roughly $20,000–$25,000 for the $500/month investor. The compounding math is structured so the back half always dwarfs the front half — the first decade is the hardest, and reaching stage six places an investor statistically in the top quartile of would-be dividend retirees.
Phase Two: The Compounding Decade (Years 11–20)
Phase Two is where the math visibly changes. The portfolio has grown large enough that reinvested dividends begin meaningfully accelerating on their own. Six stages define this decade, and several carry consequences that reach deep into retirement.
Stage 7 (Year 12) marks the dividend crossover point. With roughly $200,000 in SCHD at a 3.33% trailing yield, the fund generates approximately $6,660 per year in dividends, or $555 per month — exceeding the $500 monthly contribution. Two engines are now growing the portfolio instead of one, and the smaller engine is the investor's own paycheck. For a detailed breakdown of what this inflection means for long-term income planning, see Dividend Crossover Point: When Passive Income Replaces Your Salary.
Stage 8 (Year 15) highlights yield on cost. Yield on cost measures the annual dividend relative to the original purchase price, not current market value. Using SCHD's 11.5% ten-year dividend growth rate, shares purchased in year one yield approximately 17% of their original cost by year fifteen. Using the more conservative 9.2% five-year growth rate, the figure is still approximately 13%. The earliest shares — bought when the plan felt uncertain — have quietly become the highest-yielding assets in the portfolio.
Stage 9 (Year 17) tests the plan against a real bear market. SCHD has never cut its dividend since its October 2011 inception. During the 2020 pandemic equity collapse — a 34% drawdown in roughly five weeks — SCHD held its dividend. During 2022, SCHD lost only 3.26% in total return terms while its dividend continued to grow. The investor whose auto-contribution kept running through the downturn emerged with more shares, a higher forward dividend, and a lower average cost basis than before the correction began.
Stage 10 (Year 18) introduces the income overlay layer. JEPI (JPMorgan Equity Premium Income ETF), launched May 2020, delivered a total return of +89.65% from inception through May 2026, or 11.37% annualized. Its trailing yield runs in the 8.37%–8.56% range, paid monthly. The critical constraint: JEPI distributions are largely ordinary income — not qualified dividends — because the fund uses equity-linked notes. Held in a taxable account at the 37% federal bracket plus state taxes, that tax drag eliminates the yield advantage over SCHD. JEPI belongs in a Roth IRA or 401(k), where the same yield flows with zero ordinary income tax drag. The fund is not a mistake; holding it in the wrong account is.
At a blended yield of approximately 4% on a portfolio of $800,000 to $1,000,000, the Phase Two investor is already generating $32,000–$40,000 per year in dividend income — more than halfway to the $60,000 annual target before Phase Three has even begun.
Stage 11 (Year 20) delivers the midpoint statement. At $1,000/month into a 9% blended return for twenty years, the portfolio reaches approximately $667,000. At 10%, roughly $759,000. At SCHD's 13.14% since-inception total return, the upper scenario pushes toward $1.4 million. One real investor tracked through this framework since 2014 reached year twenty with just under $900,000, having contributed approximately $240,000 of personal capital over two decades. The remaining $660,000 was time and reinvested dividends — not additional contributions.
Stage 12 (Year 20): Lowering the Beta. Before exiting Phase Two, the allocation should gradually shift toward higher SCHD and DGRO weights while adding a small BND position. SCHD carries a beta of approximately 0.61 against the broad market, meaning it moves about 61% as much as the index on any given day. BND carries a beta of approximately zero. The objective is not predicting the next correction — it is ensuring that when one arrives, no shares need to be sold at the worst possible price to fund living expenses.
Phase Three: The Income Years (Years 21–30)
Phase Three converts accumulated capital into a paycheck that arrives reliably, grows faster than inflation, and does not require selling shares to sustain itself. The six stages in this phase are about choreographing income delivery, not adding more capital.
Stage 13 (Year 22) executes the income preservation rebalance. The recommended Phase Three allocation is approximately 60% across the dividend growth core (SCHD, DGRO, VYM), 20% in JEPI inside a Roth IRA or 401(k), 10% in VOO for ongoing capital appreciation, and 10% in BND as volatility ballast. At a blended 4% yield on $800,000–$1,000,000, this structure generates $32,000–$40,000 per year in dividend income alone, before Social Security enters the calculation.
Stage 14 (Year 25) is where original SCHD shares cross into extraordinary yield-on-cost territory. Using the 11.5% ten-year dividend growth rate, SCHD shares purchased in year one now yield approximately 53% of their original purchase price annually. Using the 9.2% five-year growth rate, the figure is approximately 30%. The earliest SCHD investors from October 2011 are already living this in real time, with yield on cost exceeding 12.5% on the original split-adjusted purchase price. VIG investors who bought in 2006 at original price levels now earn approximately 6.6% yield on cost. This outcome cannot be purchased at year twenty-five — it can only be earned by refusing to sell at year three, seven, or twelve.
Stage 15 (Year 27) addresses the Social Security interaction. The average Social Security retirement benefit in 2026 is approximately $2,020 per month ($24,240 per year). Waiting until age 70 can push the maximum benefit to approximately $5,181 per month for the highest earners. Combined with $5,000 per month in dividend income, total monthly income reaches roughly $7,020. However, at that combined income level, up to 85% of the Social Security benefit becomes federally taxable under the provisional income test, which triggers at $44,000 of provisional income for married filing jointly. Qualified dividends from SCHD, DGRO, VYM, and VIG remain taxed at the preferential 0%, 15%, or 20% long-term rates regardless. For married filers in 2025, taxable income up to $96,700 qualified for the 0% rate on qualified dividends — a structural tax advantage an ordinary paycheck does not carry.
Stage 16 (Year 28) addresses sequence of returns risk — the danger that a bad market early in retirement permanently impairs a portfolio that would have survived intact if the same losses had occurred ten years later. The dividend-based defense does not require selling shares to fund living expenses. BND's trailing yield of approximately 3.93% provides a non-correlated income buffer. SCHD lost only 3.26% in 2022 while growing its dividend, meaning a portfolio built on this architecture can survive a bear market without touching principal.
Stage 18: The Decision That Does Most of the Work
Stage 17 (Year 29) is the year the math closes. With a portfolio at $1.2 million to $1.5 million and a blended Phase Three dividend yield of 4%–5%, annual dividend income lands at $48,000–$75,000, or $4,000–$6,250 per month. The $5,000 per month target is no longer a projection — it is the midpoint of the live range. At SCHD's 11.5% ten-year dividend growth rate, the yield on cost on year-one shares now sits in the 80% zone of original purchase price annually: every dollar invested at the very start of the plan is sending approximately $0.80 back every twelve months.
Stage 18 (Year 30) names the most consequential decision across all eighteen stages: the dividend growth core. Not the income overlay. Not the bond buffer. Not Social Security timing. The dividend growth core — SCHD, DGRO, and VYM, weighted toward SCHD, with an optional VIG quality-consistency sleeve.
SCHD has never cut its dividend since October 2011. Its ten-year dividend CAGR of approximately 11.5% means the dividend doubles roughly every 6.3 years under the rule of 72. The dividend per share grew from approximately $0.35 in 2015 to approximately $1.05 in 2025 — roughly tripling in one decade. VYM delivers slower dividend growth of approximately 6% per year across a broader basket that adds sector diversification. DGRO sits between them with a quality screen and a ten-year total return of approximately 12.9%.
A 4% yield growing at 11.5% annually buries a stationary 8% yield over any meaningful time horizon. After thirty years, $40,000 per year of static income from a $500,000 high-yield position would be worth approximately $16,479 in today's dollars at 3% inflation. The dividend growth core does not merely keep pace with inflation — it surpasses it by an order of magnitude over the same window.
At a 4% target yield on a $1.5 million portfolio: $60,000 per year, $5,000 per month. The portfolio has done roughly 70% of the work — the remaining 30% was not interrupting it.
Contribution Scenarios: How Long Does It Take?
Five hundred dollars per month at a 9% blended return reaches the $1.5 million target in approximately 31–32 years. A thousand dollars per month gets there in 24–26 years. Two thousand dollars per month compresses the timeline to roughly nineteen years. The architecture is identical at every contribution level: the dividend growth core is the engine, SCHD is the anchor, and tax location determines how much of the yield the investor actually keeps. JEPI in the wrong account remains the single most expensive structural mistake in the entire plan.
Watch the Full 40-Minute Video Walkthrough
The numbers in this article are drawn directly from the full REAL Thirty video on the Harry's Financial Fitness YouTube channel. The video walks through all eighteen stages with complete thirty-year projections at 8%, 9%, and 10% annualized returns, shows the year-by-year dividend reinvestment math, and walks through the JEPI account location decision in real time. Watch My 30-Year Plan to $5K a Month in REAL Dividends on YouTube for the full visual walkthrough of every stage in the framework.
Disclaimer: Nothing in this article constitutes personalized financial advice. All projections assume historical dividend growth rates and total returns continue, which is not guaranteed. Tax situations, timelines, and risk tolerances are personal. Consult a qualified financial advisor and your accountant before committing capital.