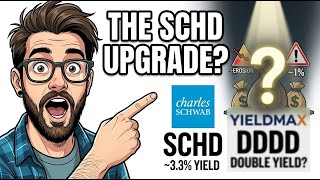
A new ETF called DDDD quietly listed on the New York Stock Exchange on March 11, 2026, carrying a single headline promise: pay investors exactly double what SCHD pays. With nearly $4 million in assets already accumulated and relatively little mainstream coverage, the YieldMax US Stocks Target Double Distribution ETF has attracted early attention from dividend investors seeking higher passive income from a familiar portfolio of companies. Yet there is a critical detail buried in the prospectus that most headlines ignore — as of this writing, DDDD has paid zero distributions to shareholders. Not a reduced amount. Zero.
This analysis is educational in nature and does not constitute financial advice. Historical data from comparable covered call funds is used to estimate potential DDDD outcomes, as the fund itself has not yet paid a distribution. Always conduct independent research before making investment decisions.
Key Takeaways
- DDDD (YieldMax US Stocks Target Double Distribution ETF) launched March 11, 2026, and holds SCHD shares directly — not a synthetic structure
- The fund uses a covered call spread to target approximately double SCHD's yield, or roughly 6.6% annualized if SCHD yields around 3.3%
- The expense ratio is 1.01% — approximately 16 times higher than SCHD's 0.06%
- Across the YieldMax fund family, approximately 74% of all distributions have historically been classified as return of capital (ROC), not earned income
- Legacy covered call ETFs like QYLD have seen share prices decline roughly 29% from inception while significantly underperforming their underlying indexes
- DDDD is most defensible inside a Roth IRA for investors in or near retirement who need current cash flow; it carries meaningful risks in taxable accounts and for investors still in the accumulation phase
What Is the DDDD ETF?
DDDD's legal name is the YieldMax US Stocks Target Double Distribution ETF, managed by Tidal Investments under the YieldMax brand — the same firm behind single-stock option income funds built around individual tickers like Tesla, Nvidia, and MicroStrategy. DDDD represents YieldMax's first attempt to apply that options overlay strategy on top of a broad dividend ETF rather than a single stock.
The fund launched on the NYSE on March 11, 2026, and has accumulated close to $4 million in assets. Its expense ratio is 1.01%. For context, SCHD — the Schwab U.S. Dividend Equity ETF that DDDD is designed around — charges just 0.06%. That means DDDD carries an annual cost roughly 16 times higher than its underlying holding, solely for the privilege of running an options overlay on top of it.
One detail that distinguishes DDDD from many other high-yield ETFs: the prospectus confirms the fund actually holds SCHD shares directly as its primary equity exposure. This is not a synthetic structure built around treasury bills and call options. Investors in DDDD own real exposure to the 100 companies inside the Dow Jones U.S. Dividend 100 Index — Verizon, Altria, PepsiCo, Lockheed Martin, and the rest of SCHD's holdings. The options overlay is layered on top of that direct ownership.
Distributions are scheduled on at least a quarterly cycle, timed to follow SCHD's dividend calendar. The first distribution was scheduled for July 1, 2026. At the time of this writing, no distributions have been paid.
How the Covered Call Spread Targets Double the Yield
To understand where DDDD's income is supposed to come from, it helps to contrast two different options strategies: the traditional covered call and the covered call spread DDDD employs.
A traditional covered call involves owning a stock and selling a call option on it. The seller collects a premium upfront but caps the stock's upside at the option's strike price — if the stock rallies above that strike, the gain flows to the option buyer, not the fund. Funds like QYLD use this pure at-the-money covered call approach.
DDDD uses a covered call spread, which modifies that structure. The fund sells a call at a lower strike price and simultaneously purchases a call at a higher strike. The net premium collected is smaller because the upper call costs money to buy, but the trade-off is that once the underlying rises above the upper strike, the fund's participation in further gains resumes. In theory, this preserves more long-term growth potential than a pure covered call while still generating meaningful options premium income.
The prospectus spells out the distribution target directly: if SCHD's annualized distribution yield is approximately 4% at the time of a fund distribution, DDDD targets cash distributions equivalent to an annualized rate of roughly 8% — approximately half from SCHD's own dividends and short-term cash, and the other half generated through the options strategy. With SCHD's trailing twelve-month yield currently around 3.3%, that formula implies a DDDD target distribution rate of approximately 6.6% annualized.
However, the same prospectus includes a disclosure that rarely appears in marketing materials:
"To the extent the fund's returns fall short of the double distribution target, distributions will reduce the fund's net asset value. If the fund's NAV declines over time, the dollar amount of future distributions will also decrease."
In plain terms: when the options strategy fails to generate enough income to fund the promised distribution, the fund makes up the difference by paying investors from their own share price. This mechanism — distribution from capital rather than from earned income — is built into the structure by design.
Return of Capital: The Hidden Tax Reality
One of the most consequential concepts for any investor considering DDDD is return of capital (ROC). When a fund pays a distribution classified as ROC, it is not distributing income earned during the year — it is returning the investor's own money. It appears identical to yield on a brokerage statement, but the tax treatment and long-term math are fundamentally different.
When an investor receives a return of capital distribution, two things happen. First, it is not taxed as ordinary income in the year received — a genuine tax deferral. Second, the investor's cost basis in the fund is reduced by the amount of the distribution. Once cost basis reaches zero, every subsequent distribution becomes a fully taxable long-term capital gain. The tax is not avoided; it is deferred and concentrated.
The YieldMax fund family's existing track record makes this concrete. Through mid-2025, YieldMax's single-stock option income funds distributed approximately $214 per share across the lineup. Of that total, roughly $159 per share — approximately 74% — was classified as return of capital rather than earned income. Individual funds in the family ranged from about 63% ROC on the low end to over 95% on the high end.
DDDD has not yet filed a 19a-1 disclosure (the form that itemizes distribution composition) because it has not paid a single distribution. Based on the family's historical pattern, however, it is reasonable to anticipate that a meaningful share of DDDD's future distributions will be classified as ROC, particularly in periods when the options strategy underperforms. Investors tracking distributions in a taxable account will need to account for cost basis adjustments on every payment.
What Covered Call ETF History Shows About NAV Erosion
DDDD may be new, but the covered call ETF category has a multi-decade track record that offers instructive historical precedent. The most direct comparisons are the Global X covered call family: QYLD, RYLD, and XYLD.
QYLD, which uses at-the-money covered calls on the Nasdaq 100, launched in December 2013. Over approximately twelve and a half years, its share price declined from roughly $25 at launch to around $17.80 — an erosion of approximately 29%. During the same period, the Nasdaq 100 compounded dramatically upward. RYLD, the Russell 2000 version, has posted a cumulative total return of roughly 1.5% since inception — not annualized, but cumulative over seven years — with its share price in a clear downward trend. XYLD, the S&P 500 version, has fared better but still trails its benchmark index by a wide margin over equivalent periods.
The pattern across all three funds is consistent: headline yields in the 8–12% range, share prices drifting downward over time, and total returns that underperform the underlying index by hundreds of basis points per year. DDDD's covered call spread structure differs from the pure at-the-money approach used by these funds, and it may behave differently at the margin. But the structural force is identical — cap upside to generate option premium, then distribute that premium as income — and the precedent across this generation of funds is that NAV erodes over multi-year periods.
After-Tax Math: DDDD vs. SCHD on $100,000
Consider a hypothetical $100,000 investment comparing SCHD's qualified dividend yield against DDDD's targeted distribution rate.
SCHD's current trailing twelve-month yield of approximately 3.3% produces around $3,300 in gross qualified dividends annually. At the 15% qualified dividend tax rate, the estimated after-tax income is roughly $2,805.
DDDD's targeted distribution rate of approximately 6.6% would target $6,600 in gross distributions on the same $100,000. Because the options-generated portion is treated as ordinary income rather than qualified dividends, the tax drag is meaningfully higher. In the 22% ordinary income bracket — and assuming, generously, zero return of capital and zero NAV erosion — the estimated after-tax take is approximately $5,148, or roughly $2,343 more per year than SCHD after federal tax.
In the 32% bracket, however, that advantage compresses sharply. DDDD's estimated after-tax take drops to approximately $4,488 — just $1,683 more than SCHD. Both figures assume zero NAV erosion and zero return of capital, two assumptions that have historically not held for covered call funds over multi-year holding periods.
For long-term perspective: SCHD has delivered approximately 12.76% in annualized total return over the past ten years. At that rate, $100,000 could potentially grow to over $330,000 in a decade. Capping that upside with a covered call overlay in exchange for a 6.6% targeted distribution has historically been a structurally expensive trade for investors still building wealth. If you are thinking about how to layer multiple dividend ETFs for income without sacrificing compounding, the 4-ETF dividend ladder using VIG, DGRO, SCHD, and DIVO is a useful framework, and the SCHD and SCHG 70/30 core-satellite strategy covers how SCHD fits into a growth-and-income portfolio structure.
Who Should (and Shouldn't) Consider DDDD?
The clearest use case for DDDD is an investor inside a Roth IRA who is in or near retirement and explicitly needs current cash flow rather than long-term compounding. Inside a Roth, the distinction between ordinary income, qualified dividends, and return of capital is tax-irrelevant. The ordinary income treatment disappears, cost basis tracking is unnecessary, and the double-yield target delivers more spendable cash today. As a tactical income sleeve — not a core holding — DDDD has a defensible case in that specific context.
Investors who should approach more carefully include anyone in the 24% federal bracket or higher considering DDDD in a taxable brokerage account. The ordinary income tax treatment and the annual cost-basis adjustments that return of capital requires both erode the headline yield advantage considerably. The strategy is also difficult to justify for investors in accumulation with a 15-plus-year investment horizon, where the compounding math on a dividend growth portfolio could structurally outperform a covered call overlay based on historical precedent.
The most important data point to watch: the 19a-1 filings that will begin appearing after July 1, 2026. These filings will itemize exactly what portion of each distribution is qualified income, options premium income, and return of capital. That composition — not the headline yield number — is what will determine whether DDDD's structure actually works for a given investor's tax situation and long-term retirement planning goals.
Watch the Full Video Breakdown
For a visual walkthrough of how the covered call spread mechanics work, how NAV erosion has played out across QYLD and RYLD over time, and the step-by-step after-tax comparison between DDDD and SCHD, watch the full breakdown on the Harry's Financial Fitness YouTube channel. The video covers the prospectus language in detail and walks through each scenario with charts that make the compounding comparison concrete. Watch the DDDD ETF full analysis here.