- Key Takeaways
- The Dividend Yield Trap: Why a High Yield Is Usually a Warning
- The Growth-Anchored Dividend Plan: VOO, VIG, and DGRW
- Year One vs. Year Ten: The Numbers on $100,000
- The Dividend Crossover Point: When the Growers Take the Lead
- Total Wealth After 15 Years: Where the Gap Becomes Undeniable
- Why the Order Matters: Anchor With Growth First
- Watch the Full Video Breakdown
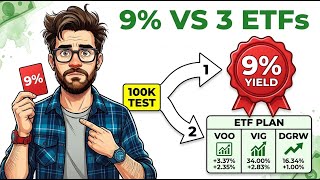
A 9% dividend yield looks like free money. It practically demands attention — nearly three times what broad-index funds pay, sitting right on the screen. But that single number is frequently the most expensive mistake a dividend investor can make. A three-ETF portfolio built around VOO, VIG, and DGRW — the Growth-Anchored Dividend Plan — has the potential to deliver significantly more wealth and more income over a lifetime than any high-yield chase. Here is why, backed by the arithmetic.
Key Takeaways
- A high dividend yield of 9% or more is often a warning sign — price erosion, covered call strategies, and leverage frequently produce payouts that cannot be sustained.
- The Growth-Anchored Dividend Plan combines VOO (60%), VIG (20%), and DGRW (20%) to blend long-term capital growth with steadily rising income.
- Year-one income on $100,000 is approximately $1,390 with the three-ETF plan versus $9,000 from a 9% yielder — but the dividend growers typically cross over between year six and year eight.
- Over 15 years, the three-ETF plan could compound $100,000 to approximately $379,000 versus roughly $208,000 on the high-yield path — a gap of more than $170,000.
- Dividend growth compounds on an expanding principal base; a static yield has no growth engine and is historically the first payout cut when markets turn volatile.
- Anchoring with VOO first is the structural move most dividend investors skip — it is what makes the income from VIG and DGRW meaningful over time.
The Dividend Yield Trap: Why a High Yield Is Usually a Warning
When a fund advertises a 9%, 10%, or 11% yield, that elevated number rarely reflects generosity. More often it signals one of three problems. First, the share price may have declined sharply because the market doubts the distribution can continue. Second, the fund may use covered call options or leverage to manufacture income it cannot organically sustain — gradually eroding its own share price with each payout cycle. Third, a substantial portion of that income is typically taxed as ordinary income, the least favorable rate, quietly reducing what investors actually keep after tax.
The result is a headline yield that sounds compelling but delivers far less real, after-tax, durable income than the sticker promises. Chasing a high yield without examining the sustainability of the payout is the core of the dividend yield trap — a strategy that appears generous in year one and quietly disappoints for every year that follows. The painful pattern is consistent: collect large checks for a year or two, then watch the distribution get cut nearly in half the moment markets turn rough. The yield was never the reward. It was the bait.
The Growth-Anchored Dividend Plan: VOO, VIG, and DGRW
Rather than seeking the highest available yield, the Growth-Anchored Dividend Plan combines three ETFs that each serve a distinct role: a growth core, a steady raiser, and a faster monthly raiser. No single fund performs all three jobs well. A pure high yielder delivers income today but almost no growth tomorrow. A pure growth fund provides the opposite. Combining the three allows each fund's strength to cover the gaps the others leave open — the result is a durable income machine rather than a single high number on a screenshot.
VOO — The Growth Anchor (60% Allocation)
VOO tracks the S&P 500, holding the 500 largest U.S. companies at an expense ratio of just 0.03% per year. Its dividend yield sits near 1%, which gives income-focused investors pause. But that low yield conceals the most important number in the strategy: total return. VOO has historically compounded at a powerful long-term rate, and its dividend itself grows at approximately 4% per year. The anchor's job is not to pay income today — it is to expand the principal base on which every future dividend from all three funds is calculated. A larger base means larger payouts from VIG and DGRW over time. Skipping the anchor and going straight for yield is compounding a stagnant pond instead of a rising tide.
VIG — The Reliable Raiser (20% Allocation)
VIG screens for companies with long track records of raising their dividends year after year — not the highest payers, but the most consistent growers. These are businesses that have continued lifting their payouts through recessions and market dislocations without flinching. VIG's expense ratio is approximately 0.06%, and its starting yield is around 1.5%. The defining characteristic is dividend growth: VIG's payout has historically increased at roughly 6% per year. That annual raise, compounding on a growing base, is the mechanism that eventually overtakes a static high yield. For a closer look at how VIG performs within a multi-fund income portfolio, the 4-ETF Dividend Ladder breakdown shows how consistent raisers anchor a reliable monthly income strategy.
DGRW — The Monthly Growth Engine (20% Allocation)
DGRW applies a quality screen to identify companies with strong and rising payouts, and it distributes income monthly rather than quarterly — a meaningful practical advantage for investors managing living expenses from their portfolio. Its expense ratio is approximately 0.28%, and its current yield sits slightly above 2%. DGRW's dividend has historically grown at approximately 8% per year, making it the highest-gear raiser in the portfolio and the fund that most accelerates the income trajectory as the years compound.
Year One vs. Year Ten: The Numbers on $100,000
The year-one comparison between a 9% yielder and the Growth-Anchored Dividend Plan is not close. On a $100,000 investment, a 9% yield produces $9,000 in annual income immediately. The three-ETF plan at a 60/20/20 split produces approximately $1,390:
- $60,000 in VOO at approximately 1.05%: $630 per year
- $20,000 in VIG at approximately 1.60%: $320 per year
- $20,000 in DGRW at approximately 2.20%: $440 per year
That is roughly $1,390 per year against $9,000 — a six-to-one gap in favor of the high yielder at the start. This is precisely why the dividend yield trap works so effectively: investors compare year one, feel the math is obvious, and never run the numbers forward.
Run those same numbers ten years out, with VIG growing at 6% annually, DGRW at 8%, and VOO at 4%, and the story reverses. Year-ten income from the three-ETF plan on the same $100,000 looks like this:
- VOO income: approximately $930 per year
- VIG income: approximately $570 per year
- DGRW income: approximately $950 per year
Combined year-ten income: approximately $2,450 per year — and still climbing with each passing year. The high-yield fund in the same period? Its income never moved, because a static yield has no growth engine inside it. If that distribution is cut by half during a market downturn — historically common for high-yield funds under stress — income drops from $9,000 to $4,500, and the advantage that once felt enormous has nearly closed.
The Dividend Crossover Point: When the Growers Take the Lead
The crossover point — the year when rising dividend income from growth-focused ETFs overtakes a flat high yield — is the quiet center of the high-yield versus dividend-growth debate. Against an ordinary high payout rather than an extreme 9% example, the growing income from the VOO/VIG/DGRW combination typically crosses over between year six and year eight. From that moment, the growth plan's income pulls ahead permanently, because compounding growth builds on itself while the static yield simply sits and waits to be cut.
This dynamic is what income investors call yield on cost: the dividend collected relative to the original purchase price keeps rising each year, until the fund that started as a low-yield investment is paying a far higher effective rate than the high yielder ever offered. The key insight is that once the crossover happens, the gap does not hold steady — it keeps widening. For a deeper look at how this crossover works in practice, the Dividend Crossover Point breakdown shows the specific portfolio math behind when passive income begins to replace a salary.
Total Wealth After 15 Years: Where the Gap Becomes Undeniable
Income is only part of the picture. Total portfolio value — the base that funds all future income — is where the arithmetic becomes decisive. Over fifteen years, the high-yield path, weighed down by weaker total return, distribution cuts, and stagnant or eroding share price, has historically compounded at around 5% per year. On $100,000, that produces approximately $208,000. The Growth-Anchored Dividend Plan, blending VOO's strong long-term return with two dividend growers, has historically compounded at a blended rate above 9% per year. On $100,000, that produces approximately $379,000.
The investor who chased the 9% yield could end up more than $170,000 poorer after 15 years — and because the portfolio is smaller, future income is smaller too. The yield chaser loses the wealth race and, eventually, the income race as well.
That is the core irony of the dividend yield trap. The investor optimizing for maximum income today ends up with less income and less wealth over time. A high yield is generous this year and stingy for every year after. Dividend growth is modest this year and increasingly generous for the rest of an investor's life. The three-fund plan wins on both measures, quietly and without fanfare.
Why the Order Matters: Anchor With Growth First
A reasonable question is why VOO belongs in a dividend portfolio at all when its yield is just 1%. The answer is that VOO's compounding is precisely what makes the income from VIG and DGRW meaningful over time. When the growth core expands the principal, every future dividend from all three funds is calculated on a larger number. The income growers ride a rising tide rather than a stagnant pond. Skip the growth anchor and allocate only to yield, and compounding happens on a slowly shrinking base — the difference between a portfolio that survives a difficult decade and one that quietly deteriorates inside it. That single structural decision, growth first, is the move most dividend investors skip entirely.
The math also scales in both directions. Whether the starting amount is $5,000 or $500,000, the same forces apply: the flat yield stays flat and risks a cut, while the growing payout lifts itself on a base the core keeps expanding. The longer the time horizon, the wider the gap becomes. Reinvesting those rising dividends along the way compounds the curve further still, because new shares are purchased at a payout level that itself keeps rising year after year. Time is the one ingredient a static high yield simply cannot manufacture.
Watch the Full Video Breakdown
For a visual walkthrough of the complete high-yield versus dividend-growth comparison — including step-by-step income projections, the crossover timeline, and the 15-year wealth gap illustrated side by side — watch the full breakdown on the Harry's Financial Fitness YouTube channel. The decade-by-decade income progression and the exact dollar figures for each ETF make the compounding story significantly easier to follow than any table can capture. Watch: Why 3 ETFs Beat Chasing the Highest Dividend Yield.