- Key Takeaways
- The One Equation Behind Every Dividend Income Target
- Climbing the Dividend Income Ladder
- What the 12% Yield Actually Costs You
- The Yield-on-Cost Reveal: How Growing Dividends Cut the Required Pile
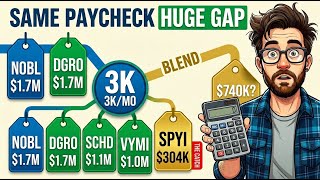
- The Blended Portfolio: $3,000 a Month for About $740,000
- The Complete Dividend Income Ladder at a Glance
- Watch the Full Video Walkthrough
To collect $3,000 a month in dividends, you could need as little as $304,000 — or as much as $1.7 million. Same income target, same monthly paycheck, yet a gap of more than five times between the two numbers. The difference is not luck or market timing. It comes down to one variable: yield. The yield you reach for determines not just how much capital you need today, but how much income you will have ten years from now.
Key Takeaways
- The core formula: divide your annual dividend target ($36,000) by your portfolio yield to find the required lump sum
- At 2% yield (NOBL, DGRO), you need approximately $1.7 million to generate $3,000 per month
- SCHD at just over 3% reduces the requirement to roughly $1.1 million
- VYMI's ~3.5% international yield lowers the target to about $1 million
- SPYI's ~12% covered-call yield cuts the entry point to around $304,000 — but trades away future income growth and carries a heavier tax burden
- A blended four-fund portfolio at ~5% yield reaches $3,000 per month for approximately $740,000, combining income today with income that grows
The One Equation Behind Every Dividend Income Target
$3,000 a month equals $36,000 a year — the annual income a portfolio must generate. To find the lump sum required, divide that yearly figure by the yield of whatever you own.
Lump sum needed = $36,000 ÷ portfolio yield
Higher yield means a smaller pile. Lower yield means a larger one. This single formula is what separates a $304,000 entry point from a $1.7 million entry point — and it is why there is no single answer to how much you need to make $3,000 a month in dividends. The answer is a ladder, and every rung of that ladder asks you to make a different trade.
Climbing the Dividend Income Ladder
Each step up the ladder introduces a higher yield, which lowers the upfront capital required to reach $3,000 per month. But higher yield does not come free. Each rung trades something — safety, income growth, or tax efficiency. Here is how the math plays out at four key yields using real ETFs as benchmarks.
Rung 1 and 2 — The Safe Growers: NOBL and DGRO (~2% Yield)
At the bottom of the ladder sit two dividend growth funds: the ProShares S&P 500 Dividend Aristocrats ETF (NOBL) and the iShares Core Dividend Growth ETF (DGRO). NOBL holds only companies that have raised their dividend for decades, through every kind of market. That strict filter produces exceptional consistency but a low starting yield of around 2%. DGRO takes a broader approach, targeting companies with strong and rising payouts. It has historically grown its dividend faster than the aristocrats, but carries a similar starting yield of just over 2%.
At 2%, the math is straightforward: $36,000 ÷ 0.02 = approximately $1.7 million. That is a large pile for a $3,000 monthly paycheck. Both funds land at roughly the same entry cost, which is why many investors dismiss the safe-grower path at first glance. But the starting number is only half the story — what matters equally is what happens to the dividend over the next decade.
The Benchmark — SCHD (Just Over 3%)
The Schwab U.S. Dividend Equity ETF (SCHD) serves as a useful reference point on the income ladder. SCHD yields just over 3%, and at that yield: $36,000 ÷ 0.03 = roughly $1.1 million. That is a $600,000 reduction from the bottom rung, achieved by a modest increase in yield. SCHD has earned its place as the foundation of most dividend income portfolios, and nothing here changes that. Its role in this comparison is simply to demonstrate how dramatically the required lump sum falls as yield climbs — a small move in yield translates to a very large move in the capital required. For a closer look at how SCHD compares to a growth-oriented alternative, see this breakdown of DGRO vs. SCHD.
Rung 3 — International High Yield: VYMI (~3.5%)
The Vanguard International High Dividend Yield ETF (VYMI) holds large overseas companies — global household brands, major banks, and energy giants — that have historically paid higher dividends than their U.S. counterparts. That international premium pushes the yield to approximately 3.5%, which moves the required lump sum to around $1 million. Widening the geographic map beyond U.S. borders has cut nearly $700,000 from the bottom rung's entry cost. The trade-off is increased currency exposure and sensitivity to international market dynamics — but for investors comfortable with that, VYMI delivers meaningfully higher income without the structural complexity of a covered-call fund.
Rung 4 — The Covered-Call Shortcut: SPYI (~12%)
At the top of the ladder sits the NEOS S&P 500 High Income ETF (SPYI), a covered-call fund that owns large U.S. companies and sells options against them to generate additional income. The result is a yield near 12%, and a dramatically smaller entry cost: $36,000 ÷ 0.12 = approximately $304,000.
Compared to $1.7 million at the bottom rung, SPYI delivers the same $3,000 monthly paycheck for less than one-fifth of the investment. That is the figure that drives viral financial content — and on the surface, it makes the safe-grower rungs look absurd. But the headline yield masks a set of real costs that compound significantly over a long holding period.
What the 12% Yield Actually Costs You
A large portion of SPYI's distributions can be classified as return of capital due to how options contracts are taxed. This treatment defers some tax liability today, but it also gradually reduces your cost basis over time. On a blended effective rate, that $3,000 monthly payout might net closer to $2,200 after tax — compared to roughly $2,500 after tax from a fund paying qualified dividends. The headline yield is high; the after-tax paycheck is considerably lower.
The larger cost is structural. Selling options against a portfolio caps the upside. When the broader market rises, a covered-call fund lags because it has already sold some of that gain in exchange for income. As a result, the share price tends to drift sideways while a standard index compounds upward. And unlike NOBL or DGRO, the covered-call payout does not reliably grow. The distribution that arrives this month is roughly the same distribution that will arrive in ten years. This is the mechanics of what investors call a yield trap — a number so attractive it prevents you from asking what you are giving up to receive it. The opportunity cost of forfeiting income growth is real, the same reason that even a brief pause in a compounding dividend strategy carries a measurable dollar cost.
The Yield-on-Cost Reveal: How Growing Dividends Cut the Required Pile
NOBL's dividend has historically grown at approximately 9% per year. Allow that to compound for a decade and the income from the same position roughly doubles. A portfolio that generated $36,000 in year one could be producing close to $84,000 per year by year ten — without adding a single additional dollar. Measured against the original purchase price, the effective yield on cost climbs toward 5%.
DGRO follows a similar trajectory at a slightly more moderate pace, with income potentially rising from $36,000 toward approximately $64,000 over the same ten years. Meanwhile, SPYI's payout remains flat or drifts with options market conditions. The fund that looked expensive at the outset has, by year ten, delivered substantially more cumulative income and is still compounding. The shortcut is still paying the same distribution it paid on day one.
This is the core insight of the income ladder: a higher yield is cheaper to enter today, but a growing dividend quietly erodes that cost advantage over time — and eventually surpasses it by a wide margin.
The Blended Portfolio: $3,000 a Month for About $740,000
Neither extreme of the ladder is the optimal answer for most income investors. A blended approach — equal allocations across all four funds — captures the best properties of each rung:
- 25% in NOBL (~2% starting yield, strong dividend growth history)
- 25% in DGRO (~2%+ starting yield, historically fast dividend growth)
- 25% in VYMI (~3.5% yield, international income diversification)
- 25% in SPYI (~12% yield, immediate high income)
The blended yield across those four positions lands near 5%. At that level: $36,000 ÷ 0.05 = approximately $740,000 to reach $3,000 per month. That is less than half the cost of the all-safe-grower path, and it accomplishes something neither extreme achieves on its own: real income arriving now, with a compounding growth engine running underneath.
The mix also provides a natural cash-flow rhythm. SPYI typically pays monthly distributions, while the growth-oriented funds pay quarterly — producing a steadier cadence of income across the year. Most importantly, the blend avoids the two most costly mistakes in monthly dividend income investing: concentrating entirely in a high-yield covered-call fund and watching income stagnate for a decade, or demanding $1.7 million before beginning and indefinitely delaying the start. Investors building a dividend income strategy from scratch will find that this multi-fund structure reflects the same foundational logic as a well-constructed ETF dividend ladder — balancing current income against long-term growth inside a single portfolio.
The Complete Dividend Income Ladder at a Glance
To summarize the full range of lump sums required to generate $3,000 per month in dividends:
- NOBL / DGRO at ~2% yield: ~$1.7 million — maximum safety and income growth, highest entry cost
- SCHD at ~3% yield: ~$1.1 million — the standard benchmark for most dividend portfolios
- VYMI at ~3.5% yield: ~$1 million — international income with lower U.S. concentration
- SPYI at ~12% yield: ~$304,000 — lowest entry cost, but flat income growth and heavier taxes
- Blended four-fund portfolio at ~5% yield: ~$740,000 — income now, plus income that grows
The right lump sum for any investor is not simply a function of available capital. It is a reflection of which trade-off they are willing to make: cheaper to enter today, or richer over a decade. Now that the full range is visible — from $304,000 to $1.7 million — the real question is which rung, or which blend of rungs, fits the income timeline you are actually building toward.
Watch the Full Video Walkthrough
For a visual walkthrough of the complete dividend income ladder — including historical dividend growth data for each fund, the after-tax mechanics of covered-call distributions, and a step-by-step breakdown of how the blended four-fund portfolio comes together — watch the full video on the Harry's Financial Fitness YouTube channel.
Watch: How Much You Really Need to Make $3,000 a Month in Dividends →