- Key Takeaways
- Three Vanguard Dividend ETFs, Three Different Jobs
- Door One: VYM and Maximum Income Today
- Door Two: VIG and the Dividend Raise Machine
- Door Three: VDIG — Vanguard's Active Challenger
- All Three Measured Against the SCHD Benchmark
- Which Vanguard Dividend ETF Fits Your Situation?
- Watch the Full Comparison on YouTube
Vanguard's three dividend ETFs — VDIG, VYM, and VIG — carry the same low-cost reputation and the same brand name, but they are built for completely different investors. One delivers the highest income right now. A second starts smaller yet has historically grown its payout at more than 10% per year. And the third is so new its track record barely spans seven months. Choosing the wrong one does not just cost yield — it can cost years of compounding that cannot be recovered.
Key Takeaways
- VYM yields approximately 2.3% with 500+ holdings, but overlaps SCHD by roughly 86% — buying both is largely redundant for existing SCHD holders.
- VIG starts with a lower yield near 1.5%, but has grown its dividend at over 10% per year — historically overtaking VYM's income around year eight.
- VDIG, launched November 2025, is Vanguard's first actively managed dividend ETF and charges 0.40% — eight times VIG's expense ratio.
- SCHD is the benchmark all three are measured against: approximately 3.5% yield with 13% annual dividend growth.
- The Three Door Test — income today, the raise, or the wildcard — is the clearest framework for choosing between them.
- Timeline, not headline yield, is the deciding variable.
Three Vanguard Dividend ETFs, Three Different Jobs
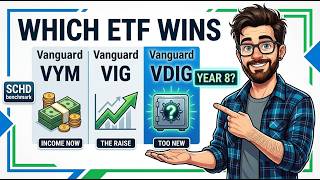
At first glance, VDIG, VYM, and VIG appear nearly identical: same company, same cost-conscious philosophy, same focus on dividend-paying companies. The differences only emerge once you examine what each fund actually selects, how fast each payout has historically grown, and what each one costs. To make that comparison concrete, this article uses a simple framework called the Three Door Test — Door One for income today, Door Two for the raise, and Door Three for the wildcard.
The SCHD benchmark runs through all three comparisons, because SCHD is the measuring stick most dividend investors already use. Understanding where each Vanguard fund sits relative to SCHD clarifies the choice faster than raw numbers alone.
Door One: VYM and Maximum Income Today
VYM, the Vanguard High Dividend Yield ETF, is the income-first choice. It currently yields around 2.3% and charges just 0.06% per year in expenses — one of the cheapest dividend funds available. On a $100,000 investment, that historically translates to roughly $2,300 per year in dividends, paid quarterly, starting immediately. For a retiree who needs cash to cover real expenses now, that upfront yield is genuinely attractive.
VYM achieves this by leaning heavily into mature, cash-generating sectors. Approximately one-fifth of the fund sits in financial services, with additional weight in energy and industrials — businesses that tend to return large portions of profit to shareholders rather than reinvesting in growth. That sector tilt is precisely why VYM's yield leads the group. The fund holds more than 500 companies, and its dividend has grown at roughly 3.8% per year — steady, but not fast.
The SCHD Overlap Problem
The most important caveat for VYM is its relationship to SCHD. The two funds share approximately 86% of their holdings. For any investor already holding SCHD as a core position, adding VYM provides almost no additional diversification — it is largely the same bet under a different ticker. Before building a position in VYM, confirm it is not simply replicating what is already in the portfolio. If genuine income-focused diversification is the goal, that overlap matters more than the yield headline.
Door Two: VIG and the Dividend Raise Machine
VIG, the Vanguard Dividend Appreciation ETF, looks worse on paper at first. Its yield sits at only around 1.5% — roughly $1,500 per year on that same $100,000 starting position. That is several hundred dollars less than VYM delivers in year one, and that gap can feel significant on a screen.
What makes VIG different is its entry requirement. Every company that enters the fund must have raised its dividend for at least 10 consecutive years. That single rule systematically filters out fragile payers, dividend traps, and companies likely to cut when conditions deteriorate. What remains is a portfolio of proven raisers — businesses that have demonstrated a genuine commitment to growing shareholder income through both good markets and bad.
The results of that filter are striking. While VYM's dividend has grown at approximately 3.8% per year, VIG's dividend has grown at over 10% per year. The fund has also delivered approximately 13% total annual returns over the past decade, and it has historically shown more resilience in down markets — including the 2022 sell-off — than many investors anticipated. VIG tilts toward technology and healthcare rather than financials and energy, meaning its holdings tend to compound earnings aggressively and reflect that compounding through rising dividends over time. The expense ratio sits at just 0.05% per year.
The Dividend Crossover Point
The most important concept in any VYM vs VIG comparison is what happens over time. In the early years, VYM's higher starting yield puts more income in the account. But dividend income is not a snapshot — it is a moving target. VYM's payout grows at approximately 3.8% annually. VIG's grows at over 10%. Each passing year narrows the gap, and if those historical growth rates were to roughly hold, VIG's annual income would surpass VYM's around year eight. After that crossover, VIG does not merely match VYM — it continues pulling further ahead each year.
This dynamic — explored in depth in the guide on the dividend crossover point — is the single most underappreciated factor in dividend ETF comparisons. A lower yield with faster growth can produce far more total income over a long holding period than a higher yield with slow growth. The variable that determines which fund wins is not the starting number — it is how long the investor actually plans to hold. Shorten the timeline significantly, and the higher yield wins. Extend it past eight to ten years at historical rates, and the growth fund tends to win decisively.
For investors building a multi-fund income portfolio, VIG pairs naturally alongside SCHD and other dividend-growth positions. See how it fits into a structured payout plan in the breakdown of the 4-ETF dividend ladder strategy.
Door Three: VDIG — Vanguard's Active Challenger
VDIG is the most unusual fund on this list. Launched in November 2025, it is Vanguard's first-ever actively managed dividend growth ETF, run by the Wellington management team. The strategy targets high-quality companies with durable earnings and consistent dividend growth records — current top holdings include Broadcom, Eli Lilly, Alphabet, Microsoft, and Mastercard. As of mid-2026, the fund is approximately seven months old.
Three characteristics separate VDIG from the other two and deserve careful consideration before committing capital:
- Size: VDIG manages approximately $25 million in assets. VIG manages over $100 billion. A smaller fund can close without warning and may trade with wider bid-ask spreads.
- Concentration: VDIG holds just 34 companies versus more than 500 inside VYM. A single poor stock selection carries a much larger impact on overall performance.
- Cost: VDIG charges 0.40% per year — eight times the cost of VIG at 0.05%. That premium is only justified if active management consistently outperforms the cheaper index alternative over a sustained period.
The fundamental issue with evaluating VDIG today is the absence of a meaningful track record. There is no five-year return series. There is no ten-year dividend history. There is not even a full 12 months of live distributions to study. An active fund earns its higher fee by outperforming cheaper passive alternatives — but that proof requires years of data across different market environments, including at least one genuine downturn. VDIG has not yet been tested through one.
That is not a dismissal of the fund's potential. Wellington is a credible manager and the strategy is coherent — concentration cuts both ways, and when active picks are right, a 34-stock portfolio can outshine a sleepy index of 500 names significantly. But a seven-month-old fund warrants a watch-and-learn allocation, not a core retirement position. Worth watching is not the same thing as proven.
All Three Measured Against the SCHD Benchmark
SCHD is the reference point most serious dividend investors use, and it sets a demanding standard. SCHD currently yields around 3.5% and has grown its dividend at approximately 13% per year — faster dividend growth than VIG and a higher yield than any of the three Vanguard funds in this comparison. Against that standard, the positioning of each fund becomes clear:
VYM is SCHD's near-twin at 86% overlap, offering a slightly different fee structure with minimal diversification benefit for existing SCHD holders. VIG is a distinct challenger with comparable growth rates and a longer index history. VDIG is the new contender still trying to earn a seat at the same table.
This framing also clarifies portfolio construction decisions. If SCHD is already a core holding, adding VYM adds almost nothing new. Adding VIG introduces genuine differentiation through different sector composition and a stricter dividend-growth screen. Adding VDIG introduces active management risk alongside the potential for above-index stock selection — a tradeoff with no performance history to evaluate yet.
Which Vanguard Dividend ETF Fits Your Situation?
No single fund wins for every investor. The right choice depends on timeline, income needs, and risk tolerance — not headline yield alone.
Choose VYM if the priority is the largest possible dividend check starting this year. It is a legitimate, low-cost fund with broad diversification across 500+ names. Just verify the SCHD overlap before adding it to an existing dividend portfolio — buying both is largely buying the same thing twice.
Choose VIG if the investment timeline is eight or more years and the goal is income that grows substantially over time. The lower starting yield is the cost of admission for faster compounding, and historically that tradeoff has rewarded patient investors well. VIG is also the only one of the three with a long, consistent index track record to examine.
Watch VDIG if active dividend management and concentrated quality exposure are appealing. Treat it as a small, exploratory position and revisit the thesis once the fund has lived through at least one real market cycle and built a meaningful dividend history. Do not let a compelling launch story substitute for a real performance record.
The most common mistake in this comparison is selecting the fund with the biggest yield number on the screen without first asking two questions: how long is the holding period, and what does the income actually need to accomplish? Those two answers, applied honestly, point clearly to the right door.
Watch the Full Comparison on YouTube
For a visual walkthrough of the Three Door Test, the crossover math, and a side-by-side breakdown of all three funds against the SCHD benchmark, watch the full video: VDIG vs VYM vs VIG: Which Vanguard Dividend ETF Actually Wins?. The video includes specific holding comparisons, sector allocation visuals, and a detailed look at how VDIG's concentrated 34-stock portfolio stacks up against VIG's broader index approach. If it made these three funds clearer, a like and subscribe supports more comparisons like this one.