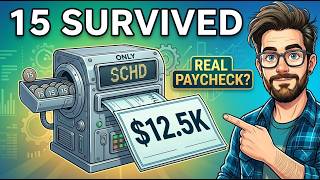
Someone put $100,000 into a single dividend fund in 2011 and never sold a share. Based on numbers reported this year, that original investment now generates roughly $12,500 annually — a 12.5% yield on cost built without living through a single dividend cut. The investor who chased the biggest yield that same year collected two cuts and ends up with a smaller check a decade later. That contrast defines the entire selection framework here: reliability of the raise matters more than the size of the yield. A fund paying 3% that lifts its payout every year will quietly outperform a fund paying 6% that cuts it twice.
Key Takeaways
- SCHD grew its dividend from roughly $0.22 per share in 2011 to over $1.00 today, producing a 12.5% yield on cost for long-term holders
- VIG requires every holding to have raised its dividend for at least 10 consecutive years — miss one raise and the company is removed at the next rebalancing
- DGRO screens out any company paying more than 75% of earnings as dividends, filtering the single most common predictor of a future cut
- NOBL holds only companies with 25+ consecutive years of dividend increases, surviving every major crash since the 1980s
- DGRW has grown its dividend at roughly 12.4% annually over five years — potentially doubling the payout in under six years
- A fee gap of 65 basis points costs over $1,600 per year on a $250,000 position, compounding against you every year regardless of market direction
The Dependable Test
Every fund on this list had to answer three questions before earning a place:
- Has it ever cut the dividend?
- Does it keep raising the dividend?
- Has it survived the years when everything else was falling apart?
Funds built purely to maximize current yield with no regard for sustainability were excluded. So were funds with a history of cutting during downturns, and products too new to have survived a real bear market. Reliability was the only standard that bought a spot on this list, and many popular high-yield funds did not make it.
The Foundation: Five Core Dividend ETFs
These first five carry long records, zero cuts on the books, and fees low enough to barely register. They form the bedrock of any dependable income portfolio.
1. SCHD — Schwab U.S. Dividend Equity ETF
SCHD holds just over 100 American companies — Coca-Cola, AbbVie, Chevron, Verizon — that must prove balance sheet quality and a real history of paying shareholders before earning entry. The yield sits around 3.4% at just 6 basis points annually. The fund has historically returned around 12.5–13% per year with dividends reinvested, and has raised its payout for over a decade with zero cuts on record. The dividend grew from roughly $0.22 per share in 2011 to over $1.00 today — which is how early holders now collect that 12.5% yield on their original cost. Its value tilt provided meaningful cushion during the 2020 and 2022 sell-offs. For a direct side-by-side comparison with its closest competitor, see DGRO vs SCHD: The Dividend Growth Stall Investors Need to See.
2. VIG — Vanguard Dividend Appreciation ETF
VIG charges just 5 basis points and yields around 1.8%. Every one of its roughly 330 holdings must have raised its dividend for at least 10 consecutive years — miss a single raise and you lose your spot at the next rebalancing. That requirement is not a bonus feature; it is the price of admission. The payout has historically climbed 8–10% per year, meaning patient investors end up with more income than someone who started with a higher static yield that went nowhere.
3. DGRO — iShares Core Dividend Growth ETF
DGRO charges 8 basis points and yields around 2.1%, holding close to 400 companies across financials and healthcare. Its defining screen excludes any company paying out more than roughly 75% of earnings as dividends — the most common predictor of a future cut. DGRO looks forward at whether a business can keep paying, not just backward at whether it has. The fund has raised its distribution every year since launch with zero cuts on record.
4. VYM — Vanguard High Dividend Yield ETF
At just 4 basis points — the lowest fee on this entire list — VYM yields around 2.4% across nearly 600 companies, including Broadcom, JPMorgan, and Exxon. With that breadth, no single company cutting its dividend can meaningfully dent total income. Its drawdowns have historically been shallower than growth-heavy peers, and it has posted strong returns while paying throughout. VYM and SCHD overlap substantially, making them better treated as alternatives rather than paired holdings.
5. VDIG — Vanguard Dividend Growth Fund
VDIG is the only actively managed fund in the foundation group, run by Wellington. The team searches for companies they believe can keep raising dividends ten and twenty years out — effectively purchasing tomorrow's dividend champions before the market recognizes them. It holds roughly 50 carefully chosen names and has raised distributions for over 20 years with no cuts on record. The concentrated, forward-looking selection is its core differentiator from the passive options above.
The Hidden Five: Overlooked Dividend ETFs Worth Knowing
These funds rarely appear on beginners' radar, but each quietly addresses a problem the well-known names leave unresolved.
6. SCHY — Schwab International Dividend Equity ETF
SCHY applies the same strict Schwab quality screen as SCHD, but across international markets — Europe, Japan, Asia Pacific, and beyond. It yields around 4% at 14 basis points. In 2025, international equities significantly outperformed U.S. stocks, and SCHY outperformed its domestic counterpart for the year. It launched in 2021 and lacks a long-term track record, but for investors whose entire dividend income comes from U.S. companies, SCHY is the most direct way to reduce that geographic concentration without abandoning the quality filter.
7. DLN — WisdomTree U.S. LargeCap Dividend ETF
DLN weights holdings by actual dividend dollars paid, not by company size. This sidesteps the classic yield trap: a stock falls sharply, its mechanical yield spikes, investors pile in for apparent value — and the strained company cuts the payment. DLN gives slots only as large as a company's real dividend output, so deteriorating businesses naturally shrink out before they can damage income. It yields around 2% at 28 basis points, holds roughly 300 large U.S. companies, and has paid out steadily since 2006.
8. DIVB — iShares U.S. Dividend and Buyback ETF
DIVB tracks total shareholder yield — direct dividends plus share buybacks. When a company reduces its share count, each shareholder's slice of every future dividend quietly grows. Companies also tend to slow buybacks before touching a dividend during difficult periods, so DIVB captures early warning signals that pure-dividend funds miss. It yields around 2% at 25 basis points, leans into high-quality technology, financial, and healthcare businesses, and has posted strong total returns since launching in 2017.
9. CGDV — Capital Group Dividend Value ETF
Capital Group, one of the world's largest and most tenured money managers, entered the ETF market with CGDV — an actively managed fund holding 60–80 companies that blends income with capital appreciation, yielding around 2.5–3%. It carries a Morningstar Gold rating, the highest conviction badge Morningstar analysts award, earned by only a small fraction of all funds. CGDV launched in 2022, so long-term performance history is limited. The institutional pedigree and top analyst rating are the credibility anchors here.
10. FVD — First Trust Value Line Dividend ETF (The Fee Lesson)
FVD holds only stocks earning a top safety rank from Value Line — independent quality control dating to the 1960s — and has delivered income reliably since 2003. But it charges 70 basis points per year, compared to VIG at 5 basis points. On a $250,000 position, that gap costs over $1,600 annually, before accounting for lost compounding over two decades of retirement. FVD's strategy is sound. Its fee is the hidden tax that slowly erodes the income it promises, working against the holder every year whether markets rise or fall.
The Specialists: Higher Yield With Clear Expectations
These three funds reach for higher yields — which is exactly where retirement income tends to go wrong when investors treat them as foundations rather than deliberate, sized positions.
11. SDOG — ALPS Sector Dividend Dogs ETF
SDOG holds the five highest-yielding stocks from each of the ten major economic sectors, equally weighted, producing about 50 names yielding around 4% at 40 basis points. Forced sector balance prevents overconcentration in any single corner of the market. The honest caveat: buying the highest yielder in each sector sometimes means buying a company under real stress, and the income has wobbled in certain years. SDOG works best as a small, deliberate contrarian position — never as a portfolio anchor.
12. RDIV — Invesco S&P Ultra Dividend Revenue ETF
RDIV holds about 60 high-yielding companies weighted by actual revenue rather than stock price, paying around 4.5–5% at 40 basis points, leaning into utilities, financials, and energy. The revenue weighting provides real protection against yield traps, but RDIV does not screen for a history of dividend raises. It offers income extraction with a fundamental safeguard — useful in a small portfolio corner once the foundation is solid, but never load-bearing.
13. PEY — Invesco High Yield Equity Dividend Achievers ETF
PEY is the most carefully constructed high yielder on this list. It requires every holding to have raised its dividend for at least 10 consecutive years, then selects the 50 highest-yielding names from that proven pool — yielding near 5%. Any company that breaks its raise streak is ejected at the next rebalance, making the fund self-cleaning in a way most high-yield products are not. The fee is 52 basis points — roughly $1,300 per year on a $250,000 position versus about $150 for SCHD. Real quality filter, real yield, real cost.
The Two Most Important Picks: NOBL and DGRW
Every screening concept discussed above — payout ratios, raise streaks, fee compression — converges in these final two funds. They represent the two most uncompromising expressions of the Dependable Test on this entire list.
14. NOBL — ProShares S&P 500 Dividend Aristocrats ETF
NOBL holds roughly 69 companies, every one of which has raised its dividend for at least 25 consecutive years. Every holding survived the dot-com crash in 2000, the 2008 financial crisis, the 2020 pandemic shock, and the 2022 rate spike — and raised the payout through all of it. The fund weights holdings equally, and its rule is merciless: the instant any company cuts or freezes its dividend, it is ejected at the next rebalancing without sentiment or exception. NOBL has historically lagged VYM and SCHD on raw five-year total return, and its fee of 35 basis points is higher than the Vanguard options. But consider what a single cut does to the math. Two retirees each start with $100,000. The first chases a 4.7% yielder, collecting $4,700 in year one. A downturn cuts the payment 30% and recovery is slow. The second owns a steady 3.4% raiser — just $3,400 in year one — that lifts the payment every year without interruption. By year ten, the second retiree could potentially collect close to $8,700 annually, while the first remains near $4,000. One cut erased a decade of head start. You cannot fake 25 straight years of dividend increases — either it is in the record, or it is not. For a retirement portfolio framework built around NOBL, see 3-Bucket Dividend Strategy: DIVO, NOBL & SCHD for Retirement.
15. DGRW — WisdomTree U.S. Quality Dividend Growth ETF
DGRW yields only around 1.6% — lower than almost every other fund on this list. Most investors move on after that first glance. That move may be the single most expensive mistake in dividend investing. DGRW has grown its dividend at roughly 12.4% per year over the last five years — the fastest pace of any fund here. At that rate, the payout doubles in under six years. A $50,000 investment paying about $800 in year one could potentially pay around $2,500 per year by year ten — a yield on original cost of roughly 5%, still climbing with no ceiling. Compared to PEY's near-5% yield today, DGRW pays far less in the early years. But at its historical growth rate, DGRW's income historically crosses over and surpasses it around year 14 — and the gap widens every year after that. Beyond income, the same strong businesses driving dividend increases are also growing earnings, so the share price of a quality growth fund tends to rise alongside the payout. A static high yielder can hand you the check; DGRW can potentially give you a rising check and a growing nest egg at the same time. The fee is 28 basis points — modest for the fastest-growing income stream on this entire list.
What the Full List Adds Up To
Spreading $250,000 evenly across the six steadiest foundational funds produces a blended yield of around 2.5% — roughly $6,250 in the first year. Raise that payment at a conservative 8% annually, consistent with the historical pace of these growers, and within ten years the same money could potentially pay over $13,000 per year without selling a single share. Over that decade, cumulative cash collected approaches $100,000 — nearly 40% of the original principal — while the underlying shares continue compounding.
A reliable dividend is not the one that pays you the most this month. It is the one that is still paying you — and paying you more — thirty years from now when you need it most.
SCHD anchors the foundation. SCHY and DIVB cover geographic and structural blind spots most investors never see. PEY, SDOG, and RDIV serve as small, deliberate specialist positions held for exactly what they are — never as load-bearing income engines. NOBL and DGRW represent the two most uncompromising forms of the never-cut philosophy: one proven across 25 years of crashes, one compounding at a rate that reshapes the long-game math entirely.
Before buying any income fund, apply the Dependable Test: has it ever cut, does it keep raising, and has it survived a real downturn. Those three questions will steer most investors clear of the most common and costly income mistakes.
Watch the Full Video Breakdown
For a complete visual walkthrough of all 15 funds — including the ranking methodology, side-by-side fee comparisons, and full yield-on-cost projection models — watch the video on the Harry's Financial Fitness YouTube channel. Every figure cited in this article is covered step by step, with the long-term compounding math shown in full detail.
This article is for educational purposes only and does not constitute financial advice. All figures cited are historical; past performance does not guarantee future results. Always conduct your own research before making any investment decision.