- Key Takeaways
- Why a Single Dividend ETF Is Not Enough
- ETF #1 — VIG: The Low-Fee Quality Anchor
- ETF #2 — SCHD: The Cash Flow Engine
- ETF #3 — DGRO: The Diversification Bridge
- ETF #4 — DGRW: The Growth Ramp Nobody Talks About
- The Forever Raise Stack: How Four Calendars Beat One
- How to Build the Stack: A Step-by-Step Framework
- Watch the Full Breakdown
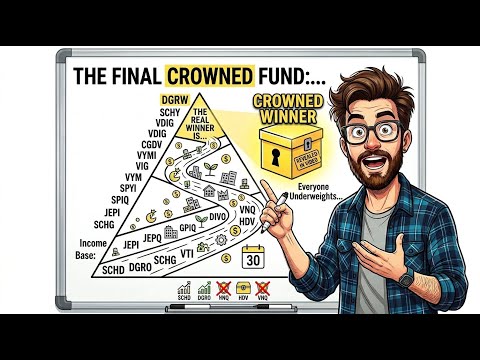
For dividend income investors, a rising payment stream is the ultimate objective — not just yield today, but a larger deposit every year for the next two or three decades. Four exchange-traded funds, when combined into a single portfolio, have historically delivered exactly that: VIG, SCHD, DGRO, and DGRW. Each one plays a distinct role, and their distribution raise calendars are staggered across the year in a way that keeps the aggregate income line climbing even when one fund pauses its increase. Together, they form what this breakdown calls the Forever Raise Stack.
Key Takeaways
- VIG (Vanguard Dividend Appreciation ETF) carries an expense ratio of just 0.04% — the lowest of the four — and anchors the portfolio with mega-cap dividend growers that have raised consecutively for at least ten years
- SCHD (Schwab US Dividend Equity ETF) yields approximately 3.33% with a five-year dividend growth rate near 13%, making it the cash flow engine of the stack
- DGRO (iShares Core Dividend Growth ETF) overlaps with SCHD on only 18% of its holdings, making it a genuinely distinct diversification layer despite both being classified as dividend growth funds
- DGRW (WisdomTree US Quality Dividend Growth Fund) posts the highest dividend growth rate of the four but also carries the highest expense ratio at 0.28%
- The four funds reset distributions on different calendar schedules, creating a smoothing effect that reduces the risk of a flat income year across the combined portfolio
- A $100,000 equally weighted allocation could potentially grow from roughly $1,500–$2,000 in year-one income to $8,000–$10,000 by year twenty at half the historical growth rates, with dividends reinvested
Why a Single Dividend ETF Is Not Enough
Most dividend investors begin with one fund and assume the income will rise steadily every year. In practice, every ETF occasionally pauses or trims its raise during adverse market conditions. When that happens to a single-fund portfolio, the income line stalls for an entire calendar year. The solution is not finding a perfect fund — it is owning multiple funds with overlapping dividend quality screens but non-overlapping payout schedules. That calendar mismatch is what separates a true dividend growth portfolio from a collection of dividend funds that happen to share the same account.
The real-dollar cost of over-concentrating in a single dividend ETF is documented in Pausing Dividend ETFs for 6 Months: The $13,900 Mistake — a concrete reminder that raise-calendar risk is as real as any other portfolio risk an income investor faces.
Disclaimer: This article is for informational purposes only and does not constitute financial advice. Always conduct your own research before making investment decisions.
ETF #1 — VIG: The Low-Fee Quality Anchor
VIG — the Vanguard Dividend Appreciation ETF — is the foundation of the Forever Raise Stack. Its underlying index requires a minimum ten-consecutive-year dividend raise history for inclusion, which means every holding is already a proven dividend grower before it enters the fund. That screening process filters for durability, not just current yield.
Current metrics from the most recent filings: VIG trades near $233 per share, carries a yield of approximately 1.5%, and has an expense ratio of just 0.04% — one of the lowest fees in the entire dividend ETF universe. Assets under management exceed $124 billion, eliminating any practical concern about liquidity or fund closure.
The top ten holdings inside VIG read like a list of American mega caps that have shown no sign of stopping their raises: Broadcom, Apple, Microsoft, JPMorgan Chase, Eli Lilly, Exxon Mobil, Walmart, Johnson & Johnson, Visa, and Costco. Sector allocation skews toward technology (approximately 26%), financials (roughly 20%), healthcare (about 16.5%), and consumer defensives (around 10%).
VIG is not a high-yield vehicle. Its 1.5% starting yield will disappoint any investor prioritizing immediate income. Its purpose is different: the companies inside it are built to keep raising for decades, and at 0.04%, almost nothing leaks out of the compounding process along the way. Year-one income is modest; the real value compounds into years ten through twenty.
ETF #2 — SCHD: The Cash Flow Engine
SCHD — the Schwab US Dividend Equity ETF — is the income anchor of the stack and the most widely held of the four among dividend growth investors. It trades near $32.50 per share, yields approximately 3.33%, and carries an expense ratio of 0.06%. Assets under management are roughly $93 billion. SCHD holds approximately 100 high-quality dividend payers selected through a screen that evaluates cash flow, dividend growth history, and balance sheet strength.
The raise track record behind SCHD is among the strongest in the ETF dividend space: a five-year dividend growth rate near 13% and a ten-year dividend growth rate around 11%. Those are exceptional figures for a fund that simultaneously yields more than 3%.
The top holdings tell a different story than VIG: Texas Instruments, Qualcomm, UnitedHealth, Chevron, Coca-Cola, ConocoPhillips, Merck, Verizon, PepsiCo, and Procter & Gamble. There is no Apple, no Microsoft, no Nvidia. SCHD screens for cash flow rather than growth momentum, and its concentration in industrials, healthcare, and consumer staples gives it a meaningfully different behavior profile from VIG in nearly every market environment.
SCHD's raise calendar does not match VIG's — one of the structural advantages of holding both simultaneously. For a direct comparison of how SCHD's historical raise trajectory compares to DGRO, the analysis at DGRO vs. SCHD: The Dividend Growth Stall Investors Need to See walks through the divergence in detail.
ETF #3 — DGRO: The Diversification Bridge
DGRO — the iShares Core Dividend Growth ETF — sits in the middle of the stack on every key metric. It trades near $71.50 per share, yields between 2% and 2.25%, and carries an expense ratio of 0.08%. Assets under management are approximately $38 billion. With roughly 400 holdings, DGRO is the most diversified fund of the four. It launched in June 2014, giving it more than a decade of live performance through multiple market cycles.
Top holdings include Exxon Mobil, Johnson & Johnson, JPMorgan Chase, Apple, AbbVie, Microsoft, Philip Morris, Procter & Gamble, Home Depot, and Merck. There is visible overlap with VIG on the technology and financial names, and overlap with SCHD on healthcare and energy. DGRO bridges those two worlds intentionally, serving as the fund that smooths the space between VIG's quality tilt and SCHD's income tilt.
The most important data point for DGRO's inclusion in the stack: DGRO and SCHD overlap on only 18% of their holdings. Two funds that both carry the dividend growth label are delivering two genuinely different baskets of stocks. That 18% figure is the strongest argument for owning both simultaneously rather than treating them as interchangeable alternatives and choosing one over the other.
ETF #4 — DGRW: The Growth Ramp Nobody Talks About
DGRW — the WisdomTree US Quality Dividend Growth Fund — is the least-discussed of the four but posts the highest dividend growth rate of the group by one important measure. It launched in May 2013, giving it more than a decade of public history. Assets under management are approximately $16.8 billion — smaller than the other three but still institutional grade. The fund holds 301 names and carries an expense ratio of 0.28%, the highest of the four. That fee is the primary trade-off investors must acknowledge before adding it to a portfolio.
DGRW's methodology screens for quality and earnings growth rather than pure dividend longevity, and the top holdings reflect that distinction clearly: Nvidia, Microsoft, Apple, Exxon Mobil, Home Depot, Meta, Chevron, Coca-Cola, UnitedHealth, and Alphabet. This is a noticeably different return engine from SCHD, which avoids most of these names entirely.
The metric that justifies DGRW's place in the stack despite its higher fee: its historical dividend growth rate sits in the low-to-mid teens — the highest of the four ETFs. Higher dividend growth means the income produced by the DGRW slice steepens faster than what VIG, SCHD, or DGRO generate individually. For a long-term income investor, a higher blended expense ratio paid in exchange for the steepest dividend growth trajectory in the group is a defensible trade when the time horizon extends fifteen years or more.
DGRW overlaps with DGRO on approximately 48% of its holdings, but the top-weight differences are large enough that the two behave like cousins rather than twins. DGRO provides broader exposure across 400 names; DGRW concentrates into quality growth and delivers a steeper income ramp. Investors who prefer a three-fund structure can remove DGRW and run VIG, SCHD, and DGRO cleanly — but the highest dividend growth rate in the group leaves with it.
The Forever Raise Stack: How Four Calendars Beat One
The staggered raise schedule is the operational core of this framework. VIG tends to raise distributions in late summer. SCHD raises in the spring. DGRO raises in the fall window. DGRW resets on WisdomTree's own methodology cadence. Because these cycles do not share the same calendar, a year in which one fund pauses or reduces its raise is unlikely to produce a flat aggregate income line — the remaining three typically carry the total higher.
The four ETFs do not share the same raise calendar. That mismatch is exactly what gives the full stack its quiet superpower: calendar diversification meeting dividend growth screening.
Consider a hypothetical $100,000 portfolio split equally across the four funds — $25,000 into each. With current yields, the starting annual income falls somewhere between $1,500 and $2,000. Left untouched with dividends reinvested, and assuming the historical dividend growth rates hold at even half their published pace, the annual income could reach $4,000 to $5,000 by year ten and potentially $8,000 to $10,000 by year twenty. The income compounds not because any single ETF doubled, but because each fund raised its payment a little, almost every year, and those raises stacked on top of one another across the entire portfolio.
How to Build the Stack: A Step-by-Step Framework
The right starting point depends on the income shape an investor is trying to build and the number of positions they are willing to manage long term:
- One fund: SCHD covers the most ground for the average dividend growth investor — meaningful yield today combined with an above-average raise track record spanning more than a decade.
- Two funds: Add VIG to introduce the lowest-fee quality anchor and gain exposure to mega-cap dividend growers that do not appear inside SCHD's portfolio.
- Three funds: Add DGRO for the 400-name diversification layer and the 18% SCHD overlap figure that makes it a genuine complement rather than a near-duplicate.
- Four funds: Add DGRW for the steepest income ramp and the highest historical dividend growth rate in the group, accepting a higher blended portfolio expense ratio in exchange.
Each addition changes the shape of the income curve without requiring earlier positions to be sold. The stack builds progressively, and each fund earns its slot by doing a specific job none of the others cover.
Watch the Full Breakdown
For a visual walkthrough of the Forever Raise Stack — including how the four payout calendars stagger month by month and how the aggregate income line holds up when one fund pauses a raise — the full video covers the math in detail. Watch 4 Dividend ETFs That Raise Your Income Every Single Year on the Harry's Financial Fitness YouTube channel for the complete framework, including guidance on evaluating which fund combination fits a specific income target and time horizon.