In 2006, buying a dividend fund cost between $10 and $20 every time you placed a trade, the average equity fund charged more than 1% a year, and the two largest dividend ETFs in America today did not yet exist. A savings account paid more than most dividend stocks because the Federal Reserve had rates near 5.25%. Twenty years of published index, fund-industry and Federal Reserve data show that almost everything about the mechanics of dividend investing has since reversed — but twelve core principles have not moved at all, surviving 2008, 2020 and the fastest rate-hiking cycle in four decades.
Key Takeaways
- Fund costs, trading commissions and product choice have all collapsed in the investor's favor since 2006, while interest rates have swung from 5.25% to zero and back twice
- Dividend growers returned 10.22% annualized over 52 years versus -0.96% for dividend cutters, according to Ned Davis Research data published by Hartford Funds
- S&P Dow Jones Indices recorded 61 dividend cuts in 2008 and 639 dividend decreases in Q2 2020 alone, proving dividend income is not guaranteed
- Morningstar's Russel Kinnel research found the cheapest quintile of funds succeeds at roughly 62% versus about 20% for the priciest quintile
- Morningstar's 2026 Mind the Gap study found investors earned 8.7% annually over the ten years ending December 2025 versus 9.9% for the funds themselves — a permanent 1.2-point annual behavior gap
- The twelfth and decisive constant is investor behavior itself: none of the other eleven principles work unless an investor can hold their position through a bad year
What Actually Changed in 20 Years of Dividend Investing
The most dramatic shift is cost. According to the Investment Company Institute's annual study, the asset-weighted average expense ratio for equity mutual funds fell from 1.04% in 1996 to 0.41% by 2025, a 62% decline. For exchange-traded funds specifically, the average equity ETF charged 0.28% in 2005 and about 0.14% by 2024. In February 2026, Vanguard cut expense ratios on 84 share classes across 53 funds — roughly a quarter of its U.S. lineup — with individual cuts averaging 27%, taking one of its dividend funds from five basis points to four.
Trading itself became free. Commissions of $10 to $20 per trade were standard through the mid-2000s, falling to roughly $5 to $8 by 2017 before collapsing entirely in the first week of October 2019, when Schwab announced zero commissions and Fidelity, TD Ameritrade and every major retail broker followed within about six weeks. Combined with fractional shares, which spread across major brokers around 2019 and 2020, the minimum sensible investment fell from several hundred dollars to about one dollar.
Product choice exploded from a handful of funds to hundreds. The Vanguard Dividend Appreciation ETF launched in April 2006 and the Vanguard High Dividend Yield ETF that November represented the state of the art at the time; a new actively managed dividend fund listed as recently as September 2, 2026. Notably, almost none of today's popular dividend funds existed for the full 20-year window — the Schwab U.S. Dividend Equity ETF (SCHD) launched in October 2011, the Dividend Aristocrats and WisdomTree quality growth funds both launched in 2013, and only two funds, both from Vanguard, cover anything close to the full period. Any 20-year chart for a fund that didn't exist that long is likely built from index data the fund itself never earned.
Interest rates completed a round trip — and then some. The federal funds rate sat near 5.25% through most of 2006, fell to essentially zero by December 2008 and stayed there for seven years, rose through 2018-19, was slashed to zero again in March 2020, then climbed sharply through 2022-23 to fight inflation. As of early September 2026, the target range sits at 3.5%-3.75%, with markets pricing a real chance of another hike — an environment that echoes where 2006 started. Tax treatment, by contrast, mostly stabilized: the three-tier qualified dividend structure of 0%, 15% and 20% has held since 2013, with the 2026 zero-percent bracket running to $49,450 for single filers and $98,900 for joint filers.
The 12 Constants That Held Through Every Crisis
Dividend Growers Beat High Yielders
The best-documented finding in dividend investing comes from a 52-year Ned Davis Research dataset, published by Hartford Funds, covering 1973 through 2025. It is provider-published rather than independent academic research, but the pattern is consistent with decades of index data.
Companies that grew or initiated a dividend returned 10.22% annualized. Dividend payers overall returned 9.20%. Non-payers returned 4.21%. Companies that cut or eliminated their dividend returned -0.96% annualized.
In dollar terms, $10,000 compounding at the growers' rate for 20 years becomes roughly $70,000. At the non-payers' rate it becomes about $23,000. At the cutters' rate, that same $10,000 shrinks to roughly $8,200 — a loss, over two decades, in a rising market. Today's funds reproduce that same ordering: SCHD yields just over 3% with roughly 9%-10.5% payout growth over five and ten years, while the Vanguard Dividend Appreciation ETF, which requires ten straight years of increases, yields under 1.5% but has grown its payout about 9% annually. Investors weighing which fund fits this pattern may find the comparison in DGRO vs SCHD: The Dividend Growth Stall Investors Need to See useful.
The Payout Ratio Is the Real Safety Signal
Yield alone does not indicate safety — the proportion of earnings paid out does. This has moved from academic finding to standard industry practice: the iShares Core Dividend Growth ETF explicitly screens out companies paying more than 75% of earnings as dividends, and broad industry guidance treats 60%-80% as a rising risk signal and anything above 80% as a serious warning. A company paying out half its earnings has room to survive a weak year; one paying out 95% does not.
Dividends Do Get Cut — 2008 and 2020 Proved It Twice
In 2008, S&P Dow Jones Indices recorded 61 dividend cuts among S&P 500 companies, wiping out $40.6 billion in annual income; 35 of the 41 companies responsible for $37.9 billion of those cuts were financial firms. In the second quarter of 2020 alone, S&P Dow Jones Indices counted 639 dividend decreases across all U.S.-listed common stocks, versus 62 in the same quarter a year earlier — a jump of more than 900% in three months, with 50 S&P 500 companies cutting or suspending $29 billion in forward dividend payments. A Journal of Financial Research study found roughly 6% of a sample of larger U.S. companies cut their dividend and 12% suspended it entirely during that window. In both crises, the majority of dividend growth companies resumed raising payouts within two to three years — but investors who sold during the decline, rather than those whose dividends were cut, suffered the permanent losses.
Cost Still Predicts Performance
Morningstar research associated with analyst Russel Kinnel, refreshed with new data for over a decade, consistently finds that sorting funds into five groups by expense ratio produces a clear pattern: the cheapest quintile succeeds (survives and outperforms peers) at roughly 62%, while the most expensive quintile succeeds at about 20% — a threefold gap from one visible number. Vanguard's own literature echoes an outside firm's independent finding that expense ratio is the most reliable predictor of a fund's future performance. Because the average fund is now so much cheaper than in 2006, a 20-basis-point difference that used to be a rounding error can now represent the entire cost gap between two funds.
The Behavior Gap Investors Can't Escape
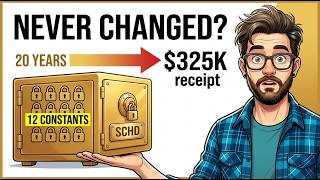
Morningstar's Mind the Gap study, updated in August 2026, found that over the ten years ending December 2025, the average dollar invested in U.S. funds earned 8.7% annually while the funds themselves returned 9.9% — a 1.2 percentage-point annual gap driven entirely by the timing of when investors added and withdrew money. Morningstar estimates this costs the industry roughly $3.8 trillion in foregone wealth, and notes the gap has appeared in every rolling ten-year period it has ever measured. On $250,000 over 20 years, that gap compounds to roughly $325,000. The encouraging detail: investors in broad, plain index funds captured almost the entire return of their funds, with the largest gaps concentrated in the most volatile, most heavily marketed products.
The One Constant That Decides the Other Eleven
Every principle above is knowable and well-documented, yet the behavior gap persists because the twelfth constant governs all the others: none of them work unless an investor can leave a position alone long enough for the pattern to play out. Every improvement of the last twenty years — zero commissions, fractional shares, hundreds of new funds each with a better story — also made it easier to abandon a strategy during a difficult year. The tools improved; investor behavior did not. A useful test is to look at what a portfolio did in 2022, when stocks and bonds fell together, and ask honestly whether it would have been added to, not just held, during that stretch. Dividend funds have taken in roughly $54 billion in 2026 alone, on pace for about $82 billion and ahead of the 2022 record, meaning an enormous amount of new capital is now entering cheaper, better-built products than existed twenty years ago. Whether that money performs well over the next twenty years will depend far less on which fund is chosen than on how many investors are still holding it in 2036.
Watch the Full Breakdown
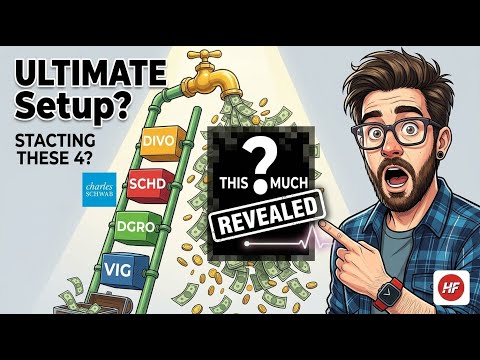
For a visual walkthrough of the full 52-year Ned Davis dataset, the 2008 and 2020 cut counts, and the payout-ratio thresholds professional index providers screen on, watch the complete video breakdown on the Harry's Financial Fitness YouTube channel. Investors building a diversified income portfolio around these constants may also want to review the 4-ETF Dividend Ladder strategy using VIG, DGRO, SCHD and DIVO for a practical application of dividend growth investing today.