- Key Takeaways
- Why Rising Interest Rates Fracture Dividend ETFs
- The Rate-Sensitive Tier: SPYD, HDV, DIVO, and VYM
- The Middle Tier: Five Funds With Real Trade-Offs
- The Rate-Proof Four: VIG, VOO, SCHG, and SCHD
- SCHD: The Only Fund That Got All Three Right
- The One Rule That Ties All 13 Funds Together
- Watch the Full Video Breakdown
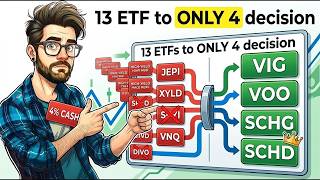
A 4% money market yield quietly overtook SCHD's payout in mid-2026 for the first time since 2022, and the June 17, 2026 Federal Reserve meeting only intensified the question every dividend investor is asking: is it time to sell and park cash? With nine of eighteen Fed members projecting at least one more rate hike and the S&P 500 dropping more than 1% on the announcement day, the pressure on dividend ETFs is not theoretical. After testing 13 dividend ETFs against every Fed rate shock since 2000—the 2004 hiking cycle, the 2015–2018 tightening run, the brutal 2022 rate shock, and today's higher-for-longer regime—one pattern emerged clearly: these funds do not respond to rising interest rates the same way. Four of the thirteen held their ground on price, total return, and income growth simultaneously. Nine did not.
Key Takeaways
- High-yield dividend ETFs concentrated in utilities and real estate function as long-duration bond proxies and fall the hardest when the Fed raises rates.
- SGOV currently out-yields SCHD by approximately 60 basis points, but SCHD's historically 10–12% annual dividend growth crosses above money market income by year three to four and keeps widening for a decade.
- In 2022—the worst rate year in a generation—SCHD declined only 5.9% while the S&P 500 fell 18.1% on a total return basis.
- The four rate-proof ETFs (VIG, VOO, SCHG, and SCHD) share quality businesses, low costs, and dividend growth—not high starting yields.
- When rates rise, the quality of the businesses underneath the yield matters more than the yield number itself.
Why Rising Interest Rates Fracture Dividend ETFs
When the Federal Reserve raises interest rates, dividend ETFs split into two fundamentally different camps. High-yield funds concentrated in utilities, real estate, and consumer staples hold assets that behave like long-duration bonds—their cash flows stretch far into the future, so when the cost of money rises, those future dollars get discounted more aggressively and prices fall quickly. Dividend growth funds, by contrast, hold quality businesses with genuine pricing power that continue raising payouts even as borrowing costs climb. That design difference—yield-first versus quality-first—determines which funds bleed and which ones hold when the Fed moves.
The Rate-Sensitive Tier: SPYD, HDV, DIVO, and VYM
The four most rate-exposed funds on this list share a common trait: a high starting yield built on top of interest-rate-sensitive sectors. The income looks attractive right up until rates move against them.
SPYD — The Yield Trap
SPYD (SPDR S&P 500 High Dividend ETF) yields approximately 4.2%–4.5% and allocates roughly one-fifth of its weight to real estate, with another significant slice in utilities—the two sectors most sensitive to rate changes. In the final quarter of 2018, when the Fed was hiking into a slowing economy, SPYD dropped approximately 21%, outpacing the S&P 500's 19.4% decline in that same window. A defensive, high-dividend fund fell harder than the broad market during a rate scare. Dividend growth on SPYD runs just 2%–4% annually, the slowest on this list. Maximum yield, maximum price sensitivity, and minimum raises is the textbook definition of a rate-exposed position.
HDV — The Situational Shield
HDV (iShares Core High Dividend ETF) gained approximately 7% in 2022, and that result gets cited constantly as evidence that high-yield funds protect investors when rates spike. The actual explanation is more specific: HDV carried approximately one-fifth of its weight in energy, and 2022 was the year energy went vertical during a commodity super-cycle. Strip out that sector tailwind and what remains is a concentrated portfolio of roughly 75 stocks. That concentration is not a structural rate defense—it was a well-timed sector bet that happened to coincide with one unusual year. HDV's 2022 resilience was situational, not systemic.
DIVO — The Capped Income Play
DIVO (Amplify CWP Enhanced Dividend Income ETF) uses a covered-call overlay to generate monthly income, currently yielding around 4.6%–4.75%. A covered call captures option premium today by capping upside tomorrow. In a rate recovery when quality dividend stocks rally sharply, the overlay limits how much of that rebound investors actually receive. DIVO also carries the highest expense ratio in this group at 56 basis points—nearly ten times the cost of several funds ranked higher. For pure current income, DIVO delivers on its stated purpose. As a rate-resilient vehicle, capped recovery and elevated fees work against investors at the exact moment the environment turns favorable.
VYM — The Familiar Underachiever
VYM (Vanguard High Dividend Yield ETF) is broadly diversified across financials, healthcare, and consumer staples and costs just 4 basis points. Its design flaw is a yield-first screen that naturally tilts toward slower-growing, more rate-sensitive companies. VYM declined only 1.4% in 2022 versus SCHD's 5.9%—edging the quality grower in one difficult year. But over a full decade, VYM returned approximately 179% cumulative against SCHD's roughly 197%. VYM also overlaps SCHD by approximately 86% of holdings, meaning adding it alongside an existing SCHD position concentrates the portfolio in the slower-growing half of the same universe rather than diversifying it.
The Middle Tier: Five Funds With Real Trade-Offs
NOBL — Unmatched Track Record, Below-Average Yield
NOBL (ProShares S&P 500 Dividend Aristocrats ETF) holds only companies that have raised their dividend for at least 25 consecutive years. The quality pedigree is unmatched on this list. The trade-off: a current yield of around 2%–2.2% that cannot compete with a 4% money market on income alone, paired with an expense ratio of 35 basis points—among the highest in this group. Exceptional businesses, genuine rate resilience, but a cost-and-yield profile that makes it difficult to favor over cheaper alternatives while cash pays this much.
SGOV — The Rate Thermometer and the Cash Debate
SGOV holds 0–3 month Treasury bills and currently yields approximately 3.9%—about 60 basis points above SCHD's current yield of roughly 3.3%. That gap drives the case for moving to cash, and it deserves a direct numerical answer. On a $100,000 starting position, SGOV pays roughly $4,000 in year one versus SCHD's approximately $3,300. Cash wins that round by $700.
But SCHD's dividend has historically grown at 10%–12% annually. By year two, the yield on cost climbs to roughly 3.6%. By year three, it approaches the money market yield. By year four, the growing payout crosses above $4,000 while SGOV remains flat—assuming the Fed even holds rates that high, which history suggests is unlikely across a four-year window. By year seven, SCHD's annual income on that original $100,000 could reach approximately $5,800. Over a full decade, the growing dividend has historically generated roughly $52,000 in total income versus approximately $40,000 from a flat-yielding cash position, before any consideration of price appreciation. SGOV measures how hot rates are today. It does not grow, and it resets toward zero the moment the Fed pivots.
SCHY, DGRW, and DGRO
SCHY (Schwab International Dividend Equity ETF) yields approximately 3.5%–4% and provides a structural hedge no domestic fund can replicate: its income comes from companies in economies running entirely different central bank rate cycles. During the current U.S. higher-for-longer stretch, several European and Asian central banks were cutting rates, meaning SCHY's dividends faced different rate headwinds than any all-domestic fund on this list. It costs 14 basis points and passes through a foreign tax credit that can matter depending on account type.
DGRW (WisdomTree U.S. Quality Dividend Growth Fund) weights holdings by earnings rather than yield, tilting toward companies that generate the profits to fund and grow dividends. The quality screen provides real rate resilience, but the 28 basis point expense ratio—more than four times the cost of several peers—quietly compounds against long-term returns every year.
DGRO (iShares Core Dividend Growth ETF) holds approximately 400 companies, each screened for a history of dividend growth. That breadth is the structural contrast to HDV's concentrated 75-stock bet: when one sector takes a rate-driven hit, the damage spreads across hundreds of names. DGRO returned approximately 87% cumulative over five years at a cost of 8 basis points. It trails SCHD marginally on current yield and growth rate—the only reason it sits one step below the top tier. For a deeper look at how the two funds diverge over a full market cycle, see DGRO vs SCHD: The Dividend Growth Stall Investors Need to See.
The Rate-Proof Four: VIG, VOO, SCHG, and SCHD
VIG — Steady and Low-Cost
VIG (Vanguard Dividend Appreciation ETF) holds companies with long, unbroken records of raising dividends and costs 4 basis points. Its trailing one-year return into mid-2026 was approximately 19.6%. The current yield of around 1.5% is intentionally modest—the fund prioritizes the growth of future payouts over current income size, which is precisely what keeps it clear of rate-sensitive sectors. VIG trails SCHD on both total return and growth rate within the top tier, but it earns its position as the most consistent, lowest-friction route to dividend growth across every rate cycle.
VOO — The Honest Benchmark
VOO (Vanguard S&P 500 ETF) belongs in this analysis as the benchmark every dividend fund is implicitly measured against. At 3 basis points—the lowest cost on this entire list—and with growth-oriented quality companies that can benefit from higher nominal earnings in a tightening environment, VOO held its ground through every rate cycle examined here. Its yield of just over 1% makes it irrelevant as an income vehicle. But on price and total return, it outperformed most of the dividend-branded funds sitting below it. Any dividend investor who is not tracking their total return against VOO may be accepting a performance trade-off without realizing it.
SCHG — The Recovery Engine
SCHG (Schwab U.S. Large-Cap Growth ETF) took a significant hit in 2022 when rising rates compressed long-duration growth valuations—and evaluating it on that single year alone would remove it from this list entirely. What followed is the more instructive data: SCHG led the market recovery through 2023 and 2024 as investors repriced for the higher-for-longer environment they had already absorbed. The same companies penalized for long-duration characteristics on the way up became the recovery engines on the way down. At 4 basis points, the fund is nearly free to hold through the full cycle. SCHG functions as the growth side of a paired SCHD-SCHG barbell strategy—income engine on one side, growth recovery engine on the other—so both sides of a rate cycle contribute to long-term returns rather than declining together.
SCHD: The Only Fund That Got All Three Right
SCHD (Schwab U.S. Dividend Equity ETF) is the only fund among the thirteen that simultaneously defended price, delivered total return, and grew its income through the worst rate environment in a generation.
In 2022, the S&P 500 fell approximately 18.1% on a total return basis. The aggregate bond index fell around 13%. Stocks and bonds declined together—the rate investor's worst-case scenario. SCHD declined approximately 5.9%. Its quality screen, which excludes utilities and real estate in favor of durable businesses with high returns on equity and strong free cash flow, absorbed more than 12 percentage points of the market's decline.
Over the trailing year into mid-2026, SCHD returned approximately 27.1%—the strongest result among the final four. The fund manages roughly $95 billion in assets at a cost of 6 basis points. Its dividend has grown at a historical rate of 10%–12% annually, compounding income regardless of the rate environment.
The contrast with the high-yield tier is clearest in a direct scenario. On a $100,000 position entering 2022, a rate-sensitive high-yield fund might have paid approximately $4,200 in dividends while its price fell around 12.5%, leaving the position worth roughly $91,700. The same $100,000 in SCHD would have paid approximately $3,300 in dividends with a 5.9% price decline, leaving the position worth roughly $97,400—approximately $5,700 ahead at year end, on a lower starting yield. In subsequent years, SCHD continued raising its payout while the high-yield fund's distribution barely moved, widening the gap with every passing quarter.
SCHD is not immune to rate pressure. A Fed hike creates short-term price friction like any equity fund. What distinguishes it is that higher borrowing costs do not threaten the businesses inside it the way they threaten leveraged utilities or debt-heavy real estate trusts. The dividend keeps growing through rate cycles, and historically, Fed-driven drawdowns in SCHD have functioned as entry points rather than permanent impairments. That is what rate-proof means in practice: not that the fund never feels the Fed, but that the Fed cannot stop the paycheck from growing.
The One Rule That Ties All 13 Funds Together
The funds that bled most—SPYD, DIVO, and HDV—all share the same DNA: high starting yields built on top of rate-sensitive sectors. The four that held up—VIG, VOO, SCHG, and SCHD—share an entirely different profile: quality businesses, low costs, and dividend growth not dependent on sector leverage. When rates rise, the size of the yield tells you almost nothing about safety. The quality of the businesses generating that yield tells you everything.
Cash via SGOV is a legitimate tactical tool when the Fed holds rates high. But it does not grow, and its yield resets toward zero the moment the Fed pivots. A quality dividend grower held as a portfolio foundation, paired with a growth engine on the other side, has historically outcompeted both the high-yield temptation and the money market alternative across every full rate cycle since 2000. For investors who have considered stepping away from dividend ETFs during a rate scare, the historical cost of that move is worth examining: see Pausing Dividend ETFs for 6 Months: The $13,900 Mistake.
Watch the Full Video Breakdown
For a visual walkthrough of all 13 funds ranked worst to best—including the SGOV vs SCHD ten-year income crossover math, the 2022 drawdown comparisons displayed side by side, and the exact methodology behind each fund's placement—watch the full breakdown on YouTube: I Tested 13 Dividend ETFs Against Every Fed Rate Shock Since 2000 — Only 4 Held Up. The visual format makes the decade-long compounding comparisons and rate-cycle performance charts significantly easier to absorb than reading the numbers alone.