- Key Takeaways
- What Makes SCHD Different From a Typical Income Fund
- The 10-Year No-Reinvestment Case Study
- Why the Account Balance Still Grew While Every Dividend Was Spent
- The Receipt Test: What Real Income Should Do
- Reinvesting vs Spending: What Each Path Actually Delivers
- What This Looks Like Starting Today
- The Tax Advantage of Qualified Dividends
- Where DGRO and VYM Fit Alongside SCHD
- Watch the Full Video Walkthrough
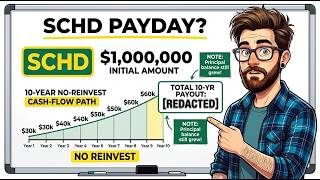
One million dollars invested in SCHD in 2016. Every dividend taken as cash and spent. Not one dollar reinvested. After ten years, that account paid out $527,000 in cash — and the balance still grew to approximately $2.3 million. If that sounds like a math error, it is not. It is the actual, sourced result that income investors have been circulating, because it quietly dismantles the argument that living off dividends means draining your principal.
Key Takeaways
- A $1 million SCHD position started in 2016, with every dividend spent and none reinvested, paid roughly $527,000 in total cash over ten years.
- Despite spending every dividend, the account balance grew to approximately $2.3 million — a gain of around 130%.
- SCHD's dividend payout has grown at an average of roughly 10% per year, roughly doubling the income stream over a decade on the same share count.
- At today's roughly 3% yield, a $500,000 position starts at approximately $16,500/year and could potentially reach $43,000/year within ten years.
- Most SCHD dividends qualify for lower long-term capital gains tax rates — a meaningful advantage over bond or CD interest taxed at ordinary income rates.
- The receipt test — real cash, a stable-or-growing balance, and an annual raise — is the clearest framework for evaluating any income investment.
What Makes SCHD Different From a Typical Income Fund
SCHD is the Schwab U.S. Dividend Equity ETF, one of the most widely held dividend funds in the country, and its design explains much of its long-term performance. The fund holds approximately 100 companies, each screened for quality and each required to have paid dividends for at least ten consecutive years before qualifying for inclusion. Any holding that falls short gets rotated out during rebalancing. The result is a self-maintaining portfolio of established, cash-generating businesses with long records of writing checks to shareholders — including through recessions and market downturns.
The expense ratio is 0.06% annually, making it one of the cheapest funds of its kind. But the figure that drives the long-term income case is not the yield. It is the dividend growth rate. SCHD's payout has grown at an average of roughly 10% per year. Over a ten-year holding period, that rate roughly doubles the income stream — on the same shares, with no additional capital deployed. A yield frozen in time tells you almost nothing about what a fund will actually pay a decade from now. The growth rate does.
The 10-Year No-Reinvestment Case Study
Consider an investor who put $1 million into SCHD in 2016 and made one deliberate choice: dividend reinvestment off. Every quarterly payout landed as cash. Every dollar was spent. No shares were ever added to the position.
In the early years, the quarterly deposits were smaller — a growing fund takes time to grow into its income. But each year, the companies inside the fund raised their payouts. Those raises were not tied to the investor adding money or the share price moving in any particular direction. They came from underlying businesses growing their profits and distributing more of them. By the second half of the decade, the same untouched position was generating significantly more cash per quarter than it did on day one.
Across ten years, the total cash paid into that account came to approximately $527,000 — averaging around $53,000 per year. Every cent was spent as income.
In much of the country, $53,000 per year is a real living — covering housing, utilities, groceries, and leaving room for travel or unexpected costs. That income arrived without the investor ever selling a single share, timing the market, or making any active decision beyond the initial purchase.
Why the Account Balance Still Grew While Every Dividend Was Spent
The instinct most investors bring to this scenario is straightforward: if you pull money out every quarter, the balance should fall. That logic applies to a savings account, where every withdrawal reduces the balance. A dividend ETF does not work that way. Dividends come from the profits of the underlying businesses — they are not withdrawals from principal. The companies keep operating, keep growing, and keep increasing in value regardless of whether the investor spends or reinvests the income paid out.
So while the investor was collecting and spending roughly $53,000 per year in dividends, the share price of the fund kept rising beneath that income stream. It was not a smooth ride. The 2022 drawdown was sharp, and holding through it required discipline. Investors who sold during that period locked in losses and ended the raise. Those who simply kept cashing the quarterly checks and held their shares let the recovery do its work. Over the full decade, the value of the original $1 million position grew to approximately $2.3 million — a gain of roughly 130% — while being used as an active income source the entire time.
The Receipt Test: What Real Income Should Do
Most income strategies fail at least one of three criteria. High-yield products can deliver large checks while the underlying principal quietly erodes — meaning the investor is essentially being paid back with their own money. Pure growth funds build large balances but pay almost nothing to live on along the way. The receipt test is a straightforward framework for evaluating any income investment:
- Real cash you can spend today — income that lands in your account and covers actual expenses
- A balance that holds or grows — principal that is not being consumed to fund the payout
- An annual raise that arrives automatically — income growth driven by the underlying businesses, not by adding more capital
Over the ten-year period examined, SCHD passed all three. The income was real and spendable. The principal more than doubled. And the annual raise arrived without any action required — driven by the fund's holdings consistently growing their dividends. That third element is what income investors call yield on cost: as the payout grows against a fixed purchase price, the effective yield on the original investment climbs year after year, independent of where the share price sits on any given day.
The quality screen inside SCHD is part of what makes that raise reliable. The fund does not hold speculative names hoping to pay someday. When a company cuts or freezes its dividend, the rebalancing process eventually replaces it with a healthier payer. The income stream is being maintained in the background, without any action from the investor. For a deeper look at how growing dividend income can eventually replace a salary, the mechanics connect directly to this compounding raise effect.
Reinvesting vs Spending: What Each Path Actually Delivers
A direct comparison clarifies the core trade-off. An investor who reinvested every dividend over the same ten-year period would likely have a balance near $3 million today — roughly $700,000 to $900,000 more than the no-reinvestment path. On paper, that looks like the clear winner.
But the reinvestor received zero cash to live on. For ten years, not one dollar of that position covered a bill, funded a trip, or handled a medical cost. All of it stayed locked inside the fund, growing a balance that required selling shares to access.
The investor who spent every dividend collected more than $527,000 in spendable cash and still walks away with a $2.3 million position. Adding the cash received to the current balance yields approximately $2.8 million in total value — not far behind the full-reinvestment path, and with a decade of real income already funded along the way. The reinvestor built a larger number on a screen. The spender built a life they could actually fund, the entire time, without touching a single share.
The distinction is not about which strategy is universally better. For someone still accumulating — years or decades from needing income — reinvesting wins by compounding the share count. For someone who needs income now, the no-reinvestment path is not a compromise. It is the entire point of the strategy.
What This Looks Like Starting Today
These projections are based on historical performance and are not guaranteed. SCHD currently yields approximately 3% on its share price. Using that yield and the fund's historical dividend growth rate as a reference point:
- $250,000 invested: starting income near $8,000/year, with the potential to grow toward $21,000/year within ten years
- $500,000 invested: starting income near $16,500/year, with the potential to grow toward $43,000/year within ten years
- $1,000,000 invested: starting income near $33,000/year, with the potential to grow toward $85,000/year within ten years
The starting numbers are modest. The ending numbers are not. The entire gap between them is explained by the annual raise — dividend growth compounding on a fixed share count, year after year, with no additional capital required. The first year of income will feel smaller than expected. The tenth year tends to reframe the entire picture.
The Tax Advantage of Qualified Dividends
Most of what SCHD distributes qualifies as qualified dividends under IRS rules. That means they are taxed at long-term capital gains rates — 0%, 15%, or 20% depending on taxable income — rather than at ordinary income tax rates. For a retired couple with modest taxable income, a significant portion of those dividends may be taxed at 0% at the federal level.
Compare that to interest income from bonds, certificates of deposit, or savings accounts, which is taxed as ordinary income at the investor's full marginal rate. Two income sources generating the same gross dollar amount can produce meaningfully different after-tax results depending on how that income is classified. For income-focused retirees, this is not a footnote — it is a material reason why a dividend-growth approach can outperform the conventional safe income alternative on a net basis.
Where DGRO and VYM Fit Alongside SCHD
SCHD does not have to stand alone. DGRO — the iShares Core Dividend Growth ETF — holds companies at an earlier stage of dividend maturity, with similar quality discipline and a growth-first orientation. It sits comfortably alongside SCHD in a portfolio and adds genuine diversification. VYM, the Vanguard High Dividend Yield ETF, offers a higher current yield, but its holdings overlap with SCHD by approximately 86%, meaning the two funds together provide far less diversification than the combined position might suggest. For investors who want to understand how the two growth-oriented funds diverge at different stages of dividend maturity, the DGRO vs SCHD comparison breaks down the specific trade-offs worth weighing before committing to either.
SCHD sits at the center of the no-reinvestment income strategy because the combination of a growing payout, mostly qualified tax treatment, and a near-zero expense ratio is precisely what a spend-it approach is built on. The yield today is just the starting line. The growth rate is what actually builds the income stream over time.
Watch the Full Video Walkthrough
The numbers in this article are clearer when laid out visually. The accompanying YouTube video covers this ten-year case study step by step — including the year-by-year dividend progression, the full comparison between spending and reinvesting dividends, and the projected income scenarios at different starting amounts. If you are evaluating SCHD for a retirement income strategy or trying to decide whether the no-reinvestment path fits your situation, the walkthrough is worth the time: watch it here on YouTube.