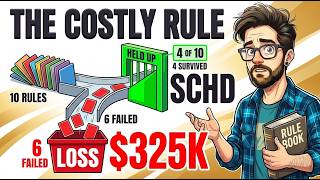
Every dividend investor carries a rulebook: buy the highest yield, reinvest everything, never sell a share, keep two years of cash, wait for a dip. To find out which dividend investing rules actually work, ten of the most popular were tested on the same $100,000 over almost twenty years of real fund data, from December 29, 2006 to October 2026. Four held up. Six did not, and one of the six cost more than $300,000.
This is a model built on published closing prices and each fund's own distribution history. Nobody ran these portfolios, and it is educational content, not financial advice. Past performance does not guarantee future results.
Key Takeaways
- Buying the highest yield was the most expensive rule: $100,000 in PEY grew to about $323,000, while the same money in VIG grew to about $649,000.
- Four rules held up: chase dividend growth, one fund is enough, reinvest every dividend, and never sell a share and live on the dividends.
- Six rules failed: highest yield, monthly payers, rebalancing to make money, dividend funds protecting you in a crash, waiting for a dip, and a two-year cash bucket.
- Waiting for a 10% dip lost to investing immediately in 110 of 204 starting months.
- Living on dividends from VYM spent about 8% less than the 4% rule and finished about $76,000 richer.
- The winning rules are about patience and simplicity; the losing ones are about chasing or predicting.
How the Dividend Rules Test Works
Each rule started with $100,000 on December 29, 2006, the hardest possible start, ten months before the 2008 crash. Every rule had to survive 2008, the long recovery, the COVID crash and the 2022 rate hikes. A rule earned HELD UP if following it left you better off than ignoring it, and FAILED if it did not.
The funds were VIG (Vanguard Dividend Appreciation), VYM (Vanguard High Dividend Yield), DVY (iShares Select Dividend), PEY (Invesco High Yield Dividend Achievers, which pays monthly), SPY (the S&P 500 as the yardstick), a Treasury bill fund for cash, and SCHD (Schwab U.S. Dividend Equity) from late 2011 when it launched.
Chapter One: What to Buy
Rule 1: Buy the Highest Yield (Failed)
At the end of 2006, PEY paid about 3.3% and DVY about 3.15%, versus about 1.7% for the S&P 500. With dividends reinvested, PEY grew to about $323,000 and DVY to about $443,000, against about $649,000 for VIG and about $779,000 for the S&P 500. The highest yielder finished last.
Even as cash income, PEY paid only about $2,000 more over almost twenty years ($76,500 versus $74,400 for VIG), while its shares were worth about $139,000 against about $437,000 for VIG. In year one, PEY paid about $3,969 versus $1,623 for VIG, but by 2011 PEY's check had shrunk to about $2,084 while VIG's had grown to about $2,178.
PEY's price fell about 74% from its peak, its income fell by almost half, and it took until 2018, eleven years, to get back to its 2007 income level.
Rule 2: Chase Dividend Growth, Not Yield (Held Up)
VIG finished at about $649,000 versus about $443,000 for DVY, a gap of about $206,000. This matches Ned Davis Research data published by Hartford Funds: since 1973, companies that grew or initiated dividends returned about 10.2% a year, versus about 6.9% for those that paid a dividend but never changed it.
VIG's yearly check grew from about $1,623 in 2007 to about $6,613 in 2025, roughly four times larger. DVY's grew from about $3,345 to about $7,275, about 2.2 times. DVY's income fell about 31% after 2008 and did not recover until 2015, while VIG's fell less than 5% and recovered by 2010. The honest twist: after nineteen years DVY still paid about 10% more cash per year, so the crossover never happened. But VIG's shares plus cash totaled about $511,000 versus about $303,000 for DVY.
Rule 3: One Fund Is Enough (Held Up)
An even mix of VIG, VYM and PEY, rebalanced yearly, grew to about $547,000, versus about $649,000 for VIG alone and about $779,000 for the S&P 500. These funds own many of the same banks, drug makers and consumer brands, so a mix is largely the same bet three times.
Starting at the end of 2011, a dividend ETF backtest shows SCHD alone grew to about $600,000, VIG about $575,000, VYM about $541,000 and DVY about $478,000. An even mix of the last three reached about $531,000, and the S&P 500 reached about $792,000. For a closer look at SCHD and growth, see SCHD and SCHG: The 70/30 Core Satellite Strategy.
Chapter Two: What to Do With the Checks
Rule 4: Reinvest Every Dividend (Held Up)
Reinvested VYM grew to about $553,000. Taking cash instead produced about $89,600 in dividends plus shares worth about $303,000, about $392,000 in all. Reinvesting was worth about $161,000 more. For VIG the gap was about $137,000 ($649,000 versus $511,000).
One year shows why: the 2009 VYM dividends of about $2,435 bought about 74 shares at crisis prices, now worth about $11,500, almost five times the original amount. In a taxable account, reinvested dividends are still taxed in the year paid, so the real-life gap is a little smaller.
Rule 5: Monthly Payers Are Better (Failed)
PEY, the only monthly payer, finished at about $323,000. Every quarterly payer finished higher, including VYM at about $553,000. Payment frequency is a calendar, not a return. If you want a monthly check, you can build one from quarterly payers by holding dividends in a Treasury bill fund and paying yourself monthly.
Rule 6: Rebalance to Make Money (Failed)
Rebalancing the three-fund dividend mix cost about $700 (about $547,300 versus about $548,000 untouched). A 50/50 mix of the S&P 500 and VIG gained about $2,400 ($716,500 versus $714,100). Both are basically nothing.
Where rebalancing matters is risk. A 60/40 stock and cash mix rebalanced yearly finished at about $421,000 versus about $521,000 untouched, but the untouched portfolio drifted to roughly 90% stocks. Rebalancing is a seat belt, not a money machine.
Chapter Three: Crashes and Retirement
Rule 7: Dividend Funds Protect You in a Crash (Failed)
From the October 9, 2007 peak to the March 9, 2009 bottom, the S&P 500 fell about 56.5%. VIG fell about 48%, but VYM fell about 59%, DVY about 63% and PEY about 74%. Three of four dividend funds fell further than the market.
Recovery to the 2007 price level took the S&P 500 until March 2013. VIG got there in August 2012, VYM in April 2013, DVY in February 2014 and PEY in June 2016, more than eight and a half years after the peak.
Rule 8: Wait for a Dip Before You Buy (Failed)
Starting in 2006, waiting for a 10% dip (January 8, 2008) would have ended with about $816,000 versus about $779,000 for investing immediately, and a 20% dip (July 2008) about $907,000. But that only worked because the test began before a historic crash.
Across 204 starting months from January 2007 to December 2023, waiting for a 10% dip lost 110 times and won 94. A 20% dip also won only 94 times, and in 12 starts the dip never came. Starting in January 2013, the 10% dip did not arrive until August 2015, leaving the waiter with about $488,000 versus about $650,000. Spreading money in over twelve months finished about $19,000 behind investing on day one.
Rule 9: Keep Two Years of Spending in Cash (Failed)
Using the 4% rule on $100,000 in the S&P 500 ($4,000 in year one, raised with inflation), a retiree without a bucket withdrew about $97,400 through September 2026 and still had about $338,000. With a two-year Treasury bill bucket, the same $97,400 was withdrawn, but only about $303,000 remained. The bucket cost about $35,000.
It did protect the retiree from selling after the 37% decline of 2008. But a small cushion of about half a year's income costs far less; see the 3-bucket dividend strategy.
Rule 10: Never Sell a Share, Live on the Dividends (Held Up)
Two retirees each put $100,000 in VYM. The dividend retiree collected about $2,624 in year one versus $4,000 for the 4% retiree, about a third less. VYM's checks fell about a quarter after 2008, from about $2,791 to about $2,110 in 2010, and did not recover until 2012. By 2025 the dividend check had grown to about $6,770, passing the inflation-adjusted 4% withdrawal of about $6,255.
Through September 2026, the 4% retiree spent about $97,400 and had about $227,000 left. The dividend retiree spent about $89,600 and had about $303,000: about 8% less spent and about $76,000 richer.
The 4% rule survived too: starting at the exact October 9, 2007 peak, withdrawals from the S&P 500 totaled about $93,400 with about $288,000 left, and Morningstar's latest research puts the safe starting rate at 3.9%. Living on VIG dividends meant about $74,400 spent with shares worth about $437,000; on the S&P 500, about $64,500 spent with shares worth about $543,000. The caveats: smaller early paychecks, occasional cuts, and fund choice matters (PEY's checks fell almost half and took eleven years to recover).
The Final Scorecard and What It Means
Held up: chase dividend growth, one fund is enough, reinvest every dividend, and never sell a share. Failed: buy the highest yield, monthly payers, rebalance for profit, dividend funds protect in a crash, wait for a dip, and keep two years of cash. The winners are about patience and simplicity; the losers are about chasing or predicting.
If you are building, own a growing-dividend fund like SCHD or VIG, or the S&P 500, avoid overlapping funds, and reinvest. If you are near retirement, decide whether you will live on dividends or use a withdrawal rule, keep about half a year of cash, and favor growers. See also Pausing Dividend ETFs for 6 Months: The $13,900 Mistake for another cost of stepping aside.
Watch the Full Video
For a visual walkthrough of every chart and result, watch the full video: I Tested 10 Popular Dividend Rules on $100,000 Over 20 Years. To see crash performance across funds, watch the follow-up, I Tested 14 Dividend ETFs Against 5 Market Crashes - Only 1 Passes. Which of these rules have you followed, and did it work for you? Tell us in the comments.
I'm not a financial advisor and this isn't financial advice. Always do your own research.