- Key Takeaways
- How the Back Test Works
- Lesson 1: Growth Won the Race Everyone Watched
- Lesson 2: The Race Was Decided Late
- Lesson 3: A Handful of Companies Drove Growth's Win
- Lesson 4: The Check Arrived Early
- Lesson 5: The Year the Income Side Won Outright
- Lesson 6: The Return You Keep Is the One You Can Sit Through
- Lesson 7: The Biggest Yields Finished Last
- Lesson 8: The Dividend Tax Drag
- Lesson 9: What a Retiree Actually Spends
- Lesson 10: Pick by Goal, Not by Tribe
- Watch the Full Video
A modelled $100,000 placed in the S&P 500 at the end of 2006 would be worth about $775,000 today. The same amount in VIG, Vanguard's Dividend Appreciation fund, would be worth about $645,000. Growth won the total-return race. But the dividend ETF side was ahead at fifteen of the first sixteen year ends, and the last day it led was May 19, 2023. This article is the other column of the ledger: what dividend ETFs actually bought investors over 20 years of dividend vs growth investing.
Everything here comes from a back test built on published prices and payouts, not a real account. It runs from the close on December 29, 2006 to the close on October 1, 2026 (19 years and 9 months, call it 20). It is educational, not financial advice, and past performance does not guarantee future results.
Key Takeaways
- Growth won on total return: SPY finished about $130,000 ahead of VIG, and QQQ turned $100,000 into just over $2 million (about 16.4% a year).
- The race was decided late. Nearly the entire $130,000 gap was built in the last three and a half years.
- Dividend funds paid cash sooner: in the cash version, VIG paid about $74,000, VYM about $90,000 and the S&P 500 about $64,000.
- The dividend funds with the biggest starting yields (DVY and SDY) finished last; VIG, with the lowest, finished first among them.
- In a taxable account, a 15% dividend tax cost VYM about $47,000, roughly 9% of its final value.
- Choose by goal, not tribe: a 50/50 mix of SPY and VIG finished at about $712,000.
How the Back Test Works
Each fund starts with the same $100,000. Every fund is run two ways. In the reinvested version, each dividend buys more shares at that day's closing price. In the cash version, dividends are paid out and the share count never changes. The income side uses VIG, VYM (Vanguard High Dividend Yield), DVY (iShares Select Dividend) and SDY (SPDR S&P Dividend). The growth side uses SPY and QQQ. SCHD appears later because it did not launch until October 2011.
Lesson 1: Growth Won the Race Everyone Watched
With dividends reinvested, $100,000 in SPY is worth about $775,000, compounding at a little under 11% a year. VIG is worth about $645,000, a little under 10% a year. One percentage point a year is more than the entire starting $100,000 over two decades. QQQ, which tracks the Nasdaq 100, is worth just over $2 million. A low-cost S&P 500 fund such as VOO is one of the best things a dividend investor could have owned in this window.
Lesson 2: The Race Was Decided Late
VIG fell about 27% in 2008 against about 37% for the S&P 500 fund, leaving the dividend side about $11,000 ahead. At the end of 2011 VIG was worth about $113,000 and the S&P 500 position about $98,000. VIG led at the end of 2012, 2015, 2019 and (by a hair) 2020, slipped behind in 2021 and led again at the end of 2022 by about $23,000.
Then came 2023 (about 26% for the S&P 500 fund against about 14.5% for VIG), 2024 (about 25% against 17%) and 2025 (about 18% against 14%). A video made in January 2023 would have reached the opposite conclusion: same funds, different finish line. Against QQQ, though, there was no late twist. VIG's lead was gone by late February 2009, and across the 2010s QQQ multiplied about five times against a little over three for VIG.
Lesson 3: A Handful of Companies Drove Growth's Win
RBC Wealth Management tracks the share of the S&P 500 held in its ten biggest stocks. From 1990 to 2015 it stayed roughly between 18% and 23%, and it was about 19% at the end of 2015. At the end of 2025 it was about 40.7%, a record; Invesco, using S&P Dow Jones Indices data, gives the same figure. In 2023 the Magnificent Seven delivered about 60% of the index's total return, and about 53% in 2024.
Leadership does change. In 2000, 2001 and 2002 the S&P 500 lost about 9%, 12% and 22%. Over those years the Dow Jones U.S. Select Dividend Index, which DVY follows, gained about 25%, then about 13%, then lost only about 4%.
Lesson 4: The Check Arrived Early
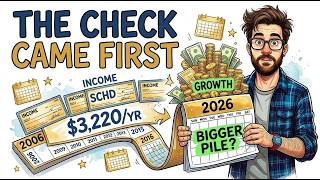
In the cash version, from 2007 to today the VIG shares paid about $74,000, the S&P 500 shares about $64,000, and VYM about $90,000, without selling a share. Adding the cash to the shares' value, the S&P 500 investor ends with about $604,000 and the VIG investor about $509,000, so growth still wins the total. VIG's payout per share rose from about 87 cents in 2007 to about $3.56 in 2025, a little over four times, while consumer prices rose about 55%. It rose in sixteen of eighteen years.
Here is the twist. In 2007 the QQQ shares paid about $330 against about $1,600 for VIG, and over the first nine years VIG paid about $21,000 against about $13,000 for QQQ. But QQQ's payout per share grew nearly twenty times from 2007 to 2025. Over the last twelve months the original QQQ shares paid about $7,200 and the VIG shares about $6,800. The dividend side's real product was income early.
Lesson 5: The Year the Income Side Won Outright
In 2022, $100,000 at the end of 2021 became about $67,000 in QQQ, about $82,000 in the S&P 500 fund, about $90,000 in VIG and about $101,800 in DVY, which actually went up. VYM finished almost exactly flat. Across the nineteen calendar years from 2007 to 2025, VIG beat the S&P 500 fund in six and DVY in seven. Invesco's data shows the Select Dividend index beat the S&P 500 in thirteen of 25 years from 2000 to 2024. These funds win mostly by losing less, which is closer to insurance than a jackpot. The premium showed up in 2023, when QQQ gained about 55% and DVY about 1%.
Lesson 6: The Return You Keep Is the One You Can Sit Through
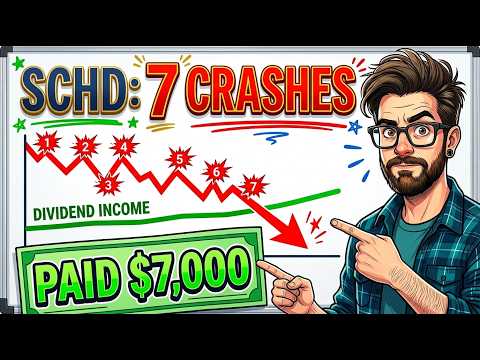
QQQ fell about 53% from its peak in 2008 and about 35% in 2022. The S&P 500 fund fell about 55% to the March 2009 low, turning $100,000 into roughly $50,000. VIG fell about 47%.
DALBAR: in 2024 the S&P 500 returned about 25% while the average equity fund investor earned about 16.5%, a gap of about 8.5 points. In 2025 the gap narrowed to under one point.
Morningstar's Mind the Gap study found that over the ten years to the end of 2025 the average dollar earned about 8.7% a year against 9.9% for the funds, a gap of about 1.2 points. As an illustration only, an S&P 500 holder losing 1.2 points a year to timing would finish with about $624,000, below the VIG investor who sat still at about $645,000.
Lesson 7: The Biggest Yields Finished Last
On 2006 prices, VIG's yield was about 1.6%, the lowest of the four, while DVY's was about 3.4%. Yet VIG finished at about $645,000 reinvested, SDY at about $480,000 and DVY at about $440,000, with VYM in the middle at about $550,000. Three reasons: VIG's payout per share grew about four times against about two times for DVY; DVY charges 38 basis points against 4 for VIG; and DVY fell about 63% from its peak in 2008 against about 47% for VIG. In the cash version DVY paid about $87,000 against $74,000 for VIG, but its shares are worth about $216,000 against $434,000. Judge a dividend fund by how fast its check grows.
Lesson 8: The Dividend Tax Drag
Dividends in a taxable account are taxed in the year received. Taxing every dividend at 15% before reinvesting, VYM finishes about $47,000 lower (about 9%), QQQ loses about 2%, VIG a little under 6% and SPY a little over 5%. One estimate puts a 2% yield taxed at 15% at a drag of about 0.3 points a year. For 2026, a single filer with taxable income up to about $49,000 pays nothing on qualified dividends; for married couples filing jointly the limit is about $99,000. Inside an IRA or Roth IRA the yearly toll disappears. For more on tax-aware income building, see the 3-bucket dividend strategy.
Lesson 9: What a Retiree Actually Spends
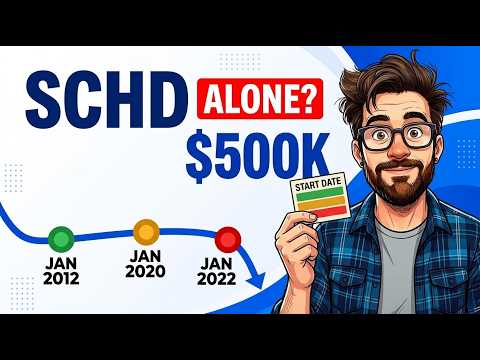
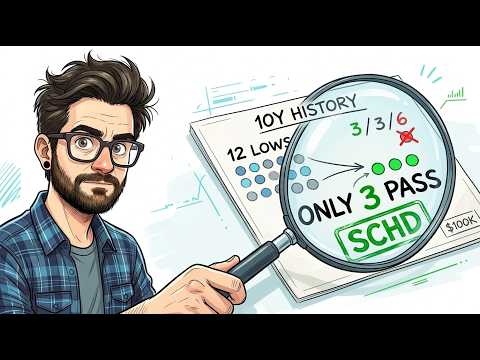
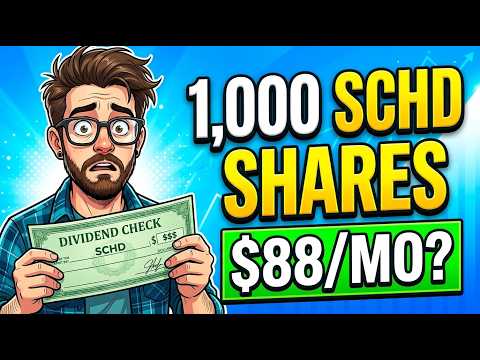
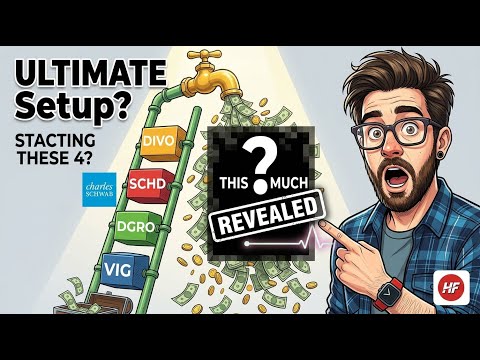
Based on trailing twelve-month payouts, $100,000 pays about $990 a year in the S&P 500 fund, about $1,560 in VIG, about $2,350 in VYM and about $3,220 in SCHD. SCHD overtook VIG in September as the largest dividend ETF, and its payout per share rose every year from 2012 to 2025, about 11% a year. To collect $40,000 a year from payouts alone takes about $1.24 million in SCHD versus about $4 million in the S&P 500 fund.
The other half: under the four percent approach, $40,000 needs about $1 million on either side. The VIG pile pays about $10,000 a year in dividends, the S&P 500 pile about $7,600, but four percent of the S&P 500 pile is about $31,000, which requires selling shares. From the end of 2011, $100,000 in SCHD grew to about $600,000 against about $785,000 for the S&P 500 fund. Our SCHD and SCHG core-satellite guide shows how the two styles can sit together.
Lesson 10: Pick by Goal, Not by Tribe
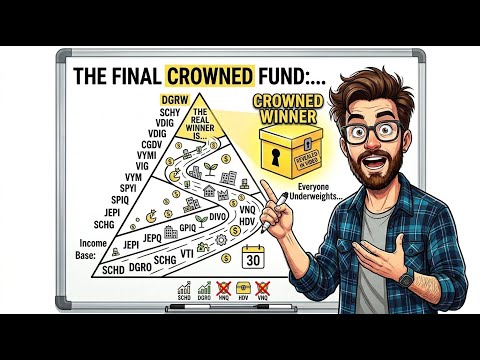
A 50/50 mix of the S&P 500 fund and VIG, rebalanced yearly, finished at about $712,000, between the two. Growth suits a long runway, ongoing contributions and the ability to watch a balance fall by half without selling. Income suits those who need the check soon, who would be tempted to sell in a drop, or who hold funds in the 0% bracket or a retirement account. The three questions: when do I need the money, what would I really do if it fell by half, and which account is it in?
Watch the Full Video
For a visual, year-by-year walkthrough of every chart and table, watch the full video: I Stayed With Dividend ETFs for 20 Years While Everyone Chased Growth. The natural next step is the compounding side of the story in 7 Years of ETF Investing: The Compounding Lessons Nobody Tells You.
Disclaimer: I'm not a financial advisor and this isn't financial advice. All figures come from a back test on one 20-year window. Past performance does not guarantee future results.