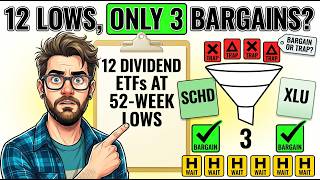
If you own an income fund right now, there is a decent chance it just hit its lowest price in a year. In October 2026, twelve dividend and income ETFs are sitting at or near their 52-week lows, and one of them shows a trailing payout of about 17% of its price. That is either the sale of the decade or the market warning you about something. This is the Sale Watch, episode two, and it tests every fund for whether the income is holding up and how each earlier 52-week low since 2017 played out.
Key Takeaways
- Of the twelve funds tested, 3 are BARGAINS (SPHD, FVD, XLU), 4 are TRAPS (KBWD, BIZD, PFF, XYLD) and 5 are WAITS (PGX, VNQ, XLRE, JEPI, DIVO).
- Every trap has the same fingerprint: a big yield and a paycheck that is already shrinking. Every bargain has a normal yield and a growing paycheck.
- XLU is the strongest bargain: about 13% below its high, yielding about 2.9%, and followed by a higher price after all four earlier 52-week lows, including 2022.
- A good fund at full price is not a bargain. DIVO passes the income and history tests but sits only about 2% below its high.
- SCHD, the yardstick, yields about 3.1% and has grown its payout about 10.5% a year over ten years, faster than any bargain on the list.
- Verdicts are opinions on published numbers, not instructions to buy or sell. A fund at a 52-week low can keep falling.
Why So Many Dividend ETFs Are on Sale at Once
On September 16, the Federal Reserve raised its target range by a quarter point to 3.75%-4.00%, its first hike since 2023. In mid-September the 10-year Treasury yield closed at 5% for the first time since July 2007, and in October it closed above 5.2%.
When a government bond pays 5%, anything that pays steady income and behaves a little like a bond gets marked down. Preferred shares, real estate, utilities and lenders make up most of this list, which is why so many dividend ETFs are at 52-week lows together.
How the Sale Watch Test Works
Test one: is the income okay? Each fund's trailing twelve-month yield (the last year of actual payments divided by the latest price) is compared with its own five-year average. A yield far above normal means either a genuine sale or a market that expects the payout to shrink. The payment trend tells you which. For the option-income funds (JEPI, XYLD, DIVO), the article quotes the distribution, which varies month to month by design.
Test two: last time. For every earlier 52-week low since 2017, what did the price and payout do over the next twelve months? The 2022 rate shock gets extra attention, since it is the closest thing to today.
A BARGAIN needs growing income, recovery after every past low (even 2022), and a real markdown of at least 4% under the one-year high. A TRAP means the discount is hiding a shrinking paycheck. WAIT means nothing is broken but the test is not clean.
Last Month's Calls, One Month Later
Last month's bargains were XLP (up about 6%), XLU (up about 5%) and FVD (up about 3%), against SCHD up about 3%. The traps were KBWD (down about 11%), BIZD (down almost 9%) and PFF (down about 3%). One month proves nothing, though. XLU slid to a fresh 52-week low the very next trading day, so a buyer that Friday would have been under water on Monday. The Sale Watch is about income and history over years, not next month's price.
The Panic Zone: KBWD, BIZD, PFF and PGX
These four have the deepest discounts, all within a quarter of a percent of their 52-week lows. Three are traps and one is a wait.
KBWD: TRAP
KBWD (Invesco KBW High Dividend Yield Financial) trades near $10.07 after a new 52-week low on October 19, about 31.5% below its high and down about 11% since last month. It paid about $1.71 per share over twelve months, a yield of about 17% against a five-year average of about 11.5%. The monthly check has already slipped from about 14.8 cents through March to 13.5 cents since July, a cut of about 9%. In 2017 it paid about $2.07 per share; in 2025, about $1.75. Its total cost is about 5.4% a year because it counts the expenses of the companies it owns. After its February 2020 low the price recovered about 6% while the dividend fell about 21%.
A price can recover while your income does not.
BIZD: TRAP
BIZD (VanEck BDC Income) trades near $11.79, about 22% under its high and down almost 9% since last month. It paid about $1.56 per share, roughly 13% of today's price, against a five-year average under 11%. Its 2025 payout of about $1.67 was down about 8% from $1.82. Only four of its seven earlier lows were followed by a higher price a year later, with a median gain of basically zero, and its last two lows both led to lower prices and smaller dividends. A 13% yield from lenders whose borrowers are starting to miss payments is the price of risk, not a discount.
PFF: TRAP
PFF (iShares Preferred and Income Securities) trades near $28.89, about 10% under its high. Its yield of about 5.65% is below its five-year average of about 6%, which only happens when income falls faster than price. Monthly checks dropped from about 17 cents to about 14 since April, roughly 17%. After its January 2022 low it lost about 8% over the next year. When a fund's yield falls while its price falls, the discount is not real.
PGX: WAIT
PGX (Invesco Preferred) trades near $9.97, about 14% below its high. It paid about 69 cents per share, close to 7% against a five-year average of about 6%, with checks level this year. But its payout has shrunk about 2.5% a year for a decade, and its two lows closest to today both failed: September 2021 (down about 16%) and March 2022 (down about 9%). The check is fixed, and history says it slowly gets smaller.
The Quiet Discounts: VNQ, XLRE, JEPI and XYLD
VNQ: WAIT
VNQ (Vanguard Real Estate) trades near $90.70, about 4% above its late-March low and about 10% below its high. It yields about 3.75%, the same as its five-year average, so it is not unusually cheap. Its payout has grown only about 1% a year over ten years. After its May 2022 low, the price fell another 9.5% over the next year.
XLRE: WAIT
XLRE (Real Estate Select Sector SPDR) trades near $41.68, about 9% under its high. It yields about 3.5%, slightly above average, with payout growth of about 4% a year. But after its May 2022 low the price fell about 8%, the same failed test as VNQ. It is the cheaper, slightly stronger real estate choice, but not yet a bargain.
JEPI: WAIT
JEPI (JPMorgan Equity Premium Income) trades near $57.11, less than 5% below its high. It distributed about $4.56 per share over twelve months, about 8% of the price, against a five-year average of around 8.5%. The distribution was about $6.36 in 2022 and about $4.22 in 2024, so it bounces by design. All four earlier lows were followed by gains (median about 12%), but two came with smaller distributions. It is great for income now, but it is not on sale.
XYLD: TRAP
XYLD (Global X S&P 500 Covered Call) trades near $41.38, only about 1.5% below its high, yet its distribution is shrinking: about 41 cents in July, 31 in August and about 30 in September. Twelve-month distributions of about $4.32 (roughly 10%) are down about 15% from the prior year, and 2025 paid about $4.27 against about $5.29 in 2022. After its March 2025 low the price rose about 13% while the distribution fell about 12%. The discount is not in the price. It is in the paycheck.
The Real Bargains: SPHD, FVD and XLU
DIVO: Good Fund, Not on Sale
DIVO (Amplify CWP Enhanced Dividend Income) trades near $47.76, about 8.5% above its March 30 low and only about 2% below its high. Its published distribution rate was about 4.9% at the end of September; a screener may show about 6% because of an extra year-end payout of about 95 cents last December. The regular monthly check rose about 10%, from about 17 cents to 19. All five earlier lows were followed by gains (median about 21%). The income and history pass, but the price does not, so the verdict is WAIT.
SPHD: BARGAIN (a side position, not a core holding)
SPHD (Invesco S&P 500 High Dividend Low Volatility) trades near $49.85, about 6% above its low and about 7% below its high. It yields about 5% against a five-year average of about 3.9%, normally a warning sign, but the payout is rising: monthly checks went from about 16 cents to about 21, a raise of roughly a third. The 2025 payout of about $1.93 compares with about $1.65 the year before. The longer record is lumpier, at about 1% a year over five years and about 5% over ten, and September's check dipped to about 20 cents. Six of six earlier lows were followed by gains (median about 11%), though 2022 passed by less than 1%. It is not a growth fund and not a core holding; size it like a side dish.
FVD: BARGAIN (the thinnest one)
FVD (First Trust Value Line Dividend) trades near $48.96, only about 4% below its high, so it barely clears the markdown bar. It yields about 2.3%, slightly above its five-year average, and its payout rose about 7.5% over the last year and about 7% a year over a decade. Six of six earlier lows were followed by gains (median about 17%), including about 3% after May 2022. It is also the most expensive of the three at 0.62% a year, ten times what SCHD charges.
XLU: The Strongest Bargain
XLU (Utilities Select Sector SPDR) trades near $41.50, almost 6% above its September 28 low of $39.25 and about 13% below its high. It costs 0.08% a year. Utilities are down for the same reason as the other bond proxies, but unlike a preferred's fixed check, a utility can raise its payout by raising rates over time, and XLU's has.
It yields about 2.9%, right at its five-year average, so the market is not pricing in a cut. The September check was about 30 cents, up from about 28 a year earlier. Calendar-year payouts have risen every year: about 80 cents in 2015, 88 in 2017, 99 in 2020, $1.03 in 2022 and $1.16 in 2025, roughly 4% a year, never backwards.
XLU has hit a 52-week low four times since 2017, and all four were followed by a higher price a year later: about 12.5% in February 2018, about 18% in March 2020, about 6.5% in June 2022 and about 22% in August 2023. The median was about 15%, and the payout rose in every one of those years.
As a model, $25,000 in XLU today pays about $730 a year. If the payout keeps growing at about 4%, that is closer to $1,060 a year in ten years, and a climb back to its high would add about $3,700 in price alone. That is not a promise, and a bargain can get cheaper before it gets better.
The Bargains Against SCHD
SCHD yields about 3.1%, against about 5% for SPHD, 2.9% for XLU and 2.3% for FVD. But over ten years SCHD's payout has grown about 10.5% a year, compared with about 7% for FVD, 5% for SPHD and 4% for XLU. Costs run 0.06% for SCHD, 0.08% for XLU, 0.30% for SPHD and 0.62% for FVD. SCHD sits about 3% below its high; XLU sits about 13% below.
As a hypothetical $100,000 split: $50,000 in SCHD, $20,000 in XLU, $15,000 in FVD and $15,000 in SPHD would pay about $3,210 a year (about $268 a month), against about $3,080 (about $257 a month) all in SCHD. The bargains add a little income and diversification, while SCHD brings the faster growth. That is a model, not a recommendation. For more on building around SCHD, see the 4-ETF dividend ladder and the 3-bucket dividend strategy.
Watch the Full Sale Watch Video
For a visual walkthrough of every fund, the yield charts and the history behind each verdict, watch the full video on YouTube. Which verdict do you disagree with? Tell us in the comments.
This is education, not financial advice. A fund at a 52-week low can keep falling, and past performance does not guarantee future results.