Most dividend investors assume bigger income comes from finding something better to buy — a higher yielder, a cleverer fund, one more holding. Over an eleven-year modelled stretch starting in 2015, that assumption barely moved the needle. What actually doubled the income from the same money was the opposite approach: removing twelve specific habits, each backed by a sourced study or published figure. None of them cost a dollar. Every one was a subtraction.
This breakdown walks through all twelve, using the Hartford/Ned Davis dividend study, Morningstar's 2026 Mind the Gap report, the 2026 qualified dividend tax brackets, and published fund overlap and expense-ratio data. Every figure below is modelled from published distribution history and named research, not a real brokerage statement — and that distinction matters for how you use these numbers.
Key Takeaways
- The Hartford/Ned Davis study (1973–2025) found dividend growers returned 10.22% annually versus -0.96% for dividend cutters — turning $100 into roughly $17,375 versus about $60.
- Two popular dividend funds can overlap by as much as 83% of holdings by weight, meaning a "diversified" portfolio may really be one fund with two fees.
- Morningstar's 2026 Mind the Gap report found a 1.2 percentage-point annual gap between fund returns and investor returns — about $96,000 of lost growth on $300,000 over eleven years.
- 2026 qualified dividend tax brackets include a 0% bracket up to $49,450 (single) or $98,900 (married filing jointly) in taxable income.
- Reinvesting dividends during a falling market, like 2022, buys more shares per dollar and is the single most counterintuitive — and valuable — mechanical habit in dividend investing.
- Yield itself is the root mistake: it's a fraction that moves opposite to your actual results, and it's the hidden cause behind the other eleven mistakes on this list.
Why Chasing the Highest Yield Backfires
The first and most common mistake is sorting a dividend fund screen by yield and buying from the top. That list isn't a ranking of opportunity — it's a ranking of how little confidence the market has in a company's ability to sustain its payout.
The Hartford Funds and Ned Davis Research study, tracking S&P 500 companies back to 1973 by dividend behavior, is the clearest evidence against yield-chasing. Companies that grew or initiated a dividend returned 10.22% annually. Companies with no dividend change returned 6.87%. Non-payers returned 4.21%. Dividend cutters returned -0.96% a year.
$100 invested in dividend growers in 1973 became roughly $17,375 by 2025. The same $100 in dividend cutters became about $60.
The volatility data makes it worse for yield-chasers: growers carried a standard deviation near 16%, while cutters carried nearly 25%. Higher yield investors weren't paid for extra risk — they paid for it.
Modelled over $100,000 starting in 2015, a high-yield allocation (proxied by the 6.87% "no change" return) ends near $207,000 after eleven years. A dividend growth allocation (10.22%) ends near $292,000 — an $84,000 gap from the same starting capital. The trap is that the high-yield option looks correct for roughly the first four years, since its year-one income is often three times larger, before the growth fund's compounding payment overtakes it.
The Hidden Cost of Fees and Fund Overlap
Morningstar's long-running research consistently finds that a fund's expense ratio is the single most reliable predictor of its future relative performance — more reliable than manager tenure or stated strategy. The Investment Company Institute's most recent fee study puts the average equity mutual fund at 40 basis points and the average index equity ETF at 14 basis points, with some newly launched dividend funds charging 67 basis points or more.
On $250,000 held for eleven years at an identical gross return, a 70-basis-point fee ends near $910,000 versus about $969,000 at a 6-basis-point fee — a $58,600 gap attributable to fee drag alone, translating to roughly $2,000 a year of permanently lost income at a 3.5% yield.
Overlap is the quieter version of the same problem. Running two commonly owned dividend funds through a portfolio overlap tool shows that about 83% of one fund's holdings by weight sit inside a larger, broader fund like VYM — though because VYM holds over 600 stocks against roughly 100, only about 14% of VYM's own weight overlaps back. Pair the smaller fund against DGRO instead, which screens for growth over yield and holds nearly 400 names, and overlap drops to about 34%. For a deeper look at how these two funds diverge over time, see DGRO vs SCHD: The Dividend Growth Stall Investors Need to See. Owning two funds that are mostly the same companies isn't diversification — it's one fund with an extra fee.
Know a Fund's Actual Track Record
Newer funds such as SCHY (international dividend, launched 2021) and CGDV (launched 2022) are legitimate holdings, but neither has a dividend growth record longer than four or five years. A chart stretching back to 2015 for either fund is showing index backtest data, not an actual fund history — a distinction worth holding onto before sizing a position around it.
Habits That Quietly Drain Compounding
The next set of mistakes isn't about what to buy — it's about what happens after the purchase, and it's where most of the lost income actually comes from.
Trading Around the News
Morningstar's August 2026 Mind the Gap report compared what funds returned against what the average investor dollar actually earned over the ten years ending December 2025. Funds returned 9.9% annually; the average dollar invested in them earned 8.7% — a 1.2 percentage-point gap, consistent with the prior year's edition covering a different decade. Across roughly 23,000 funds, that gap totals about $3.8 trillion in unrealized investor returns.
On $300,000 over eleven years, the fund's return compounds to roughly $847,000; the average investor's return compounds to about $751,000 — a $96,000 difference caused entirely by timing, not stock selection.
Fund Placement and the 2026 Tax Brackets
Under the 2026 qualified dividend brackets, qualified dividends are taxed at 0% up to $49,450 of taxable income for single filers and $98,900 for married couples filing jointly, 15% up to $545,500 single or $613,700 joint, and 20% above that. Funds generating income from option premiums don't produce qualified dividends — their distributions are taxed as ordinary income at your marginal rate. The fix is placement: qualified dividend payers belong in a taxable account to capture that preferential rate; option-income funds belong in a retirement account where distribution character stops mattering.
Dividend Reinvestment (DRIP)
Hartford Funds' standard analysis attributes roughly 85% of the S&P 500's cumulative total return since 1960 to reinvested dividends and compounding (longer-window estimates vary by methodology, from about 33% since 1940 to roughly 50% since 1930 — the direction, not the decimal, is the point). Reinvestment matters most in falling markets: in 2022, as prices fell, per-share payments rose, so each automatic reinvestment bought a larger slice of the fund than the one before it. Readers who've turned reinvestment off to hold cash have felt this directly — see Pausing Dividend ETFs for 6 Months: The $13,900 Mistake for what that pause can cost.
Holding Cash as a Long-Term Position
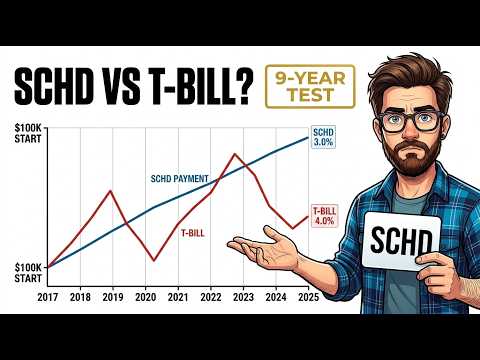
Three-month Treasury bills paid near 0–0.3% from 2015–2017, climbed toward 2.5% by 2019, fell back near zero through 2020–2021, then peaked above 5% in 2023–2024 before settling near 3.75%. Against roughly 35% cumulative inflation (about 3.1% annually) over the same window, cash sitting idle in the early years quietly lost purchasing power even as the account balance never moved.
Sector Concentration and Unnecessary Churn
Dividend screens don't produce a cross-section of the economy — they produce whichever sectors pay the most right now, typically financials, utilities, and real estate. Financials run around 24% of VYM and about 19% of the Schwab dividend fund, against roughly 13% for the S&P 500. Real estate is the inverse: the Schwab fund excludes REITs entirely by mandate, while VYM runs 7–8% versus about 2% for the broad index. Some higher-yielding income funds concentrate utilities above a quarter of the portfolio. None of this is necessarily wrong, but it should be a deliberate choice rather than something that accumulated by accident from a yield screen.
Turnover compounds the problem. DGRO turns over roughly 25% of its portfolio annually and VYM around 11%, both low by active-fund standards — but switching between two funds with 83% overlap generates spreads and potential tax bills to end up holding almost the same companies. That's motion, not rebalancing.
Why Yield Is the Mistake Behind the Other Eleven
The twelfth and final subtraction is the one that governs all the others: judging a portfolio by its yield instead of by its annual dollars paid per share.
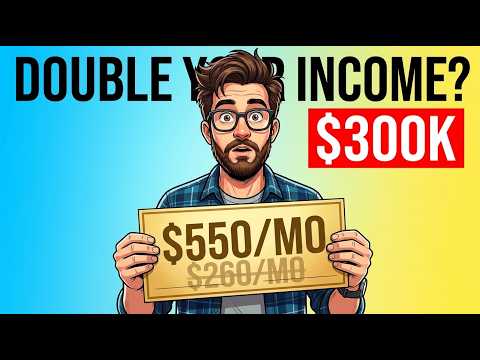
Yield is a fraction — payment over price — so it moves in the opposite direction of actual results. When price falls, yield rises and the fund looks more attractive exactly when the market has marked the holdings down. The fix is tracking annual dollars per share instead. In the modelled portfolio, one anchor fund's per-share payment went from about $0.35 in 2015 to about $1.05 in 2025 — nearly tripling. VYM's per-share dividend rose from $2.15 to $3.63 over the same period, a real increase but roughly half the growth rate. Blending a faster grower with a slower one is exactly why the overall income doubled rather than tripled.
Every other mistake on this list traces back to watching yield: buying the highest yielder, justifying a high fee because the after-fee yield looks competitive, buying overlapping funds because both show an attractive yield, favoring cash when its rate beats the fund's, trading around price moves that shift yield, misplacing option-income funds because their yield is the biggest number on the page, and ending up concentrated in financials and utilities because those sectors screen highest on yield. Switch the number you're optimizing for, and several of these mistakes stop being things you have to remember to avoid.
Putting It in Order
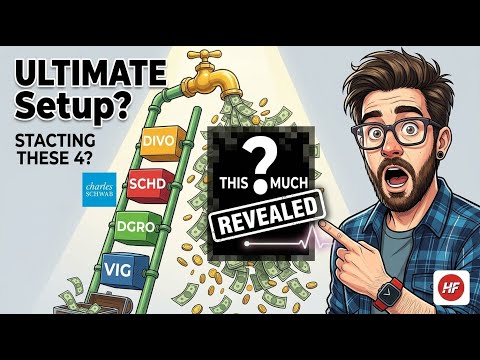
For anyone still building a position, reinvestment is the highest-leverage, lowest-effort change available — it's a checkbox, and the cost of leaving it off compounds for years, not quarters. After that: check fund overlap with a free tool, fix account placement for tax character, and only then worry about fees if you're not already in low-cost funds. Readers assembling a multi-fund approach from scratch may also find the 4-ETF dividend ladder using VIG, DGRO, SCHD, and DIVO useful as a structured starting point. Cash held as a floor for near-term spending is different from cash held as a long-term position — a floor is what prevents panic-selling in a bad month, which is exactly the behavior the Mind the Gap study measures.
For the full walkthrough with the underlying charts and year-by-year numbers, the video breaks down each of the twelve subtractions in sequence and shows exactly where the $84,000, $58,600, and $96,000 gaps come from side by side — worth watching if you want to see the modelled portfolio balances plotted out rather than just read as figures.
This is a modelled portfolio built from published distribution histories, named studies, and a chosen 2015 start date — not a real account, and not financial advice. SCHY and CGDV are under five years old with no long-term record. A different start date produces a different answer, and past dividend increases don't obligate future ones. Figures are sourced to Schwab, Vanguard, iShares, Hartford Funds/Ned Davis Research, Morningstar, the Investment Company Institute, and IRS Revenue Procedure 2025-32.