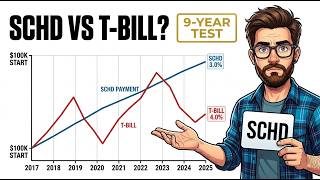
The largest dividend ETF in America is currently paying about 3.0%. A three-month Treasury bill is paying close to 4%. That gap has produced a wave of headlines this month arguing that Schwab U.S. Dividend Equity ETF (SCHD) - a fund that pulled in more than $20 billion of new money in 2026 - now yields less than cash. But a closer look at nine years of published distribution history tells a different story than the yield comparison suggests.
Key Takeaways
- SCHD's trailing yield fell because its share price rose 26.4% in 2026, not because the dividend payment shrank.
- The fund's annual dividend per share has increased every calendar year for 14 years running, including during 2020.
- Benzinga and Morningstar/TheStreet data disagree on whether SCHD or VIG is the "biggest" dividend ETF - both are correct, depending on whether you measure 2026 inflows or total assets.
- An investor who bought SCHD at the start of 2017 has a yield on cost of roughly 4.2% today, not the 3.0% shown on the fund's page.
- The three-month Treasury bill's own rate has reversed direction four times in the same nine years, from under 1% to near zero to above 5% and back to roughly 4%.
- SCHD's expense ratio is 0.06%, among the cheapest ways to hold a dividend growth strategy.
Why SCHD's Yield Actually Fell
A yield is a fraction: the distribution sits on top, the share price sits on the bottom. There are only two ways for that fraction to shrink - either the payment drops, or the price rises. As of September 11, 2026, SCHD's total return for the year stood at 26.4%. The price climbed sharply, and that increase, not a smaller dividend, is what pushed the trailing yield down.
It's also worth noting that SCHD's fund page shows more than one yield figure, and they don't agree. The trailing twelve-month distribution yield was 3.0%, while the SEC 30-day yield - a standardized measure of current portfolio income after expenses - was 3.24% on Schwab's site as of September 10. Depending on which figure gets quoted against a roughly 3.8%-4% Treasury bill rate, the "gap" reported in the headlines can look nearly 40% larger or smaller than it actually is.
Is SCHD Still the Biggest Dividend ETF?
On September 5, Benzinga reported that SCHD had become the largest dividend ETF in America, citing more than $20 billion in 2026 inflows and roughly $113 billion in assets. The same day, TheStreet cited Morningstar data putting SCHD at $113.2 billion and the Vanguard Dividend Appreciation ETF (VIG) at $130.9 billion - a gap of about $17.7 billion in VIG's favor.
Both claims are accurate. One measures new money arriving in 2026, where SCHD leads by a wide margin. The other measures total assets accumulated over each fund's lifetime, where VIG still leads, partly due to a five-year head start. Investors comparing the two funds, such as those following the 4-ETF dividend ladder strategy using VIG, DGRO, SCHD, and DIVO, should understand that "biggest" depends entirely on which metric is being cited.
Nine Years of Dividend History: The Number That Matters
Here is SCHD's approximate annual dividend per share since 2017: $0.45, $0.48, $0.57, $0.68, $0.75, $0.85, $0.89, just under $1.00, and $1.05 in 2025. The payment rose every single calendar year - 14 consecutive years through 2025.
In 2020, while U.S. companies cut or suspended dividends at the fastest pace since the financial crisis, SCHD's annual per-share payment rose from about $0.57 to about $0.68 - an increase of roughly 20% during the worst year for dividends in a generation.
That resilience traces back to the underlying index screen, which selects companies for sustained payment records, manageable debt, and cash generation, then rebalances accordingly. Funds screening purely for the highest current yield tend to own the companies most likely to cut, since a collapsing share price inflates yield right up until the payout disappears.
How Treasury Bill Rates Behaved Over the Same Nine Years
The three-month Treasury bill tells a far less stable story. It paid between roughly 0.5% and 0.8% in 2017, climbed above 2% by 2019, collapsed to near zero through 2020 and 2021, spiked above 5% by 2023 (the highest cash rate in about 40 years), and has since drifted back down toward 4%. That's four changes of direction in nine years - none of them predictable in advance, even by the people whose job it was to forecast them.
Yield on Cost: What Early SCHD Buyers Actually Earn
Using a modeled position of $100,000 invested in SCHD at the start of 2017 (roughly 4,000 shares at an estimated split-adjusted entry price), the position paid about $1,790 in 2017. With no additional money added, those same shares paid about $4,190 last year - more than doubling the income without a single new dollar invested.
Measured against the original 2017 cost basis, that works out to a yield on cost of roughly 4.2% - well above the fund's current 3.0% quoted yield, and above where the three-month bill sat for six of the past nine years. No fund page publishes this number, because published yields are always calculated for a hypothetical buyer purchasing shares this morning, not for someone who bought years ago and held.
Scaled to a $250,000 position (about 10,000 shares), the same pattern holds: dividends of roughly $4,500 in 2017 grew to about $10,500 last year. Rolling the same $250,000 in three-month Treasury bills earned about $2,500 in interest in 2017 and roughly $9,600 today - a result driven entirely by the bill rate quadrupling, an event nobody predicted or controlled. SCHD's growth, by contrast, came from roughly 100 companies raising their dividends nine years running.
The Cost Advantage
SCHD charges an expense ratio of just 0.06% - $60 a year on a $100,000 position. SGOV, the popular T-bill ETF, charges 0.09%, and DGRO charges 0.08%. For investors comparing dividend growth funds directly, the DGRO vs. SCHD dividend growth comparison is a useful next read.
When a Treasury Bill Actually Wins
None of this makes SCHD a universal substitute for cash. Consider an investor who needs $40,000 in spending money next year with certainty. At a bill fund's roughly 3.7% yield, covering that requires about $1.1 million in bills. At SCHD's 3.0% yield, matching the same $40,000 today requires roughly $1.3 million.
For money that will be spent within 12 months, a Treasury bill is the better tool - not a compromise, but the correct instrument. It doesn't fall 15% in a bad quarter, and the payment is backed by the U.S. Treasury. A bill functions as the floor under a portfolio, not a competitor to a dividend growth holding.
The Direction Test
Over the same nine years, the Treasury bill's rate changed direction four times, driven by Federal Reserve policy reacting to inflation data that didn't yet exist. SCHD's per-share payment rose every single year, through both the 2020 crash and the 2022 downturn, because dividend payments are tied to corporate earnings, not to short-term interest rate policy. A bill pays a fixed number for a fixed period. A dividend growth fund pays a rate of change that compounds. Those are different tools solving different problems, which is why comparing their headline yields in isolation misses the point.
What Would Change This Analysis
Three developments would weaken the case for holding SCHD through a low relative yield: a broken dividend-growth streak (an annual per-share payment decline), a rising payout ratio across the portfolio signaling that future raises are being funded by stretching rather than earnings growth, or a change to the underlying index screen that loosens the quality criteria in favor of chasing yield. None of these has occurred as of this writing, but they're worth monitoring annually rather than reacting to a single quarterly payment, since SCHD's quarterly distributions vary meaningfully even in years with steady annual growth.
For a full walkthrough of the modeled nine-year position, the yield-on-cost math, and the reasoning behind the direction test, the original video breaks down each of the twelve data checks in detail and is worth watching for the visual comparison of SCHD's dividend history against the Treasury bill's rate swings.
Investors weighing SCHD alongside other retirement income approaches may also find the 3-bucket dividend strategy using DIVO, NOBL, and SCHD useful for thinking through how a dividend growth holding fits alongside a cash reserve.