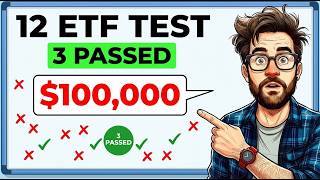
One hundred thousand dollars. Twelve monthly dividend ETFs. A single, ruthless three-question test. The result: only three funds passed — and the biggest monthly paychecks were not among them. The gap between what monthly dividend ETFs promise and what they prove is exactly what this analysis was designed to expose. All figures reflect data from mid-August 2026.
Key Takeaways
- The largest real monthly paycheck in the test — $1,139/month from QQQI — still failed because its track record is too short to prove durability.
- DGRW passed with just $117/month, the smallest check in the entire test. Proven beats promised.
- QYLD's distribution has declined at approximately -4.33% per year over five years — a quiet, compounding income problem for anyone relying on it in retirement.
- SPYI and DIVO both pay substantial monthly distributions while their share prices have risen, disproving the assumption that double-digit payouts always erode principal.
- Four funds — GPIX, GPIQ, QQQI, and IWMI — were eliminated purely for being too young. Not bad funds; insufficient evidence.
- SCHD, the quarterly benchmark outside this test, charges just 0.06% and has raised its payout for over a decade — roughly $760 per quarter on $100,000.
The Three-Question Framework
Every fund in this analysis faced the same three questions. First: how much real monthly income does $100,000 actually generate — not a screener estimate or a forward-looking target, but the trailing twelve months of distributions that actually landed in accounts? Second: what does it truly cost to own, all-in? Third: has that paycheck held up through years of market stress and recovery, or has it quietly eroded?
Pass all three, stay in. Fail any one, out. One ground rule governed every covered call fund: distribution rates were taken from the issuer's own published figures, never a third-party screener formula. For funds like GPIQ, that methodology gap represents nearly a full percentage point — roughly $1,000 per year in expected income on a $100,000 position — and the direction of the error always flatters the fund.
The measuring stick standing outside the test is SCHD. It charges just 0.06% per year, has raised its payout for well over a decade, and currently delivers approximately $3,000 per year — about $760 per quarter — on $100,000. Every monthly fund in this test is asking investors to pay more to get paid more often. This analysis decides whether that trade produces something worth the premium.
The Familiar Payers: JEPI, JEPQ, PEY, and DGRW
Four funds most income investors already know. Of the group, only one passed.
JEPI and JEPQ: The Covered Call Giants
The JPMorgan Equity Premium Income ETF (JEPI) has grown to roughly $46 billion in assets at a 0.35% annual fee. Its trailing twelve-month distributions on $100,000 worked out to approximately $7,900 — about $660 per month — and its 2022 resilience (down just ~3.5% for the year) is genuine and rare among income funds. JEPI's elimination comes down to the durability question: its monthly distribution moves with option premiums rather than compounding over time. In early 2026 alone, the payment ranged from roughly $0.34 to nearly $0.45 per share. The income is real. It is not building.
JEPQ, the Nasdaq-100 version at over $40 billion in assets, illustrates a closely related trap. In August 2026, JEPQ paid the largest monthly distribution in its history — $0.705 per share — beating its prior record set in November 2022. Anchoring a monthly budget to that record implies $1,165 per month. The trailing twelve-month reality is closer to $900 per month. That gap of roughly $265 per month represents over $3,000 per year in phantom income for anyone who plans around a single peak month rather than the honest average. A record payout in a covered call fund reflects elevated market volatility — the same force that inflated premiums during the 2022 bear market — not a structural raise in the fund's earning capacity. With a track record dating only to May 2022 and the most variable payment of any fund this size, JEPQ does not satisfy the durability standard.
PEY: Eliminated on Cost Alone
The Invesco High Yield Equity Dividend Achievers ETF (PEY) has paid monthly since 2004. Through the financial crisis, the pandemic crash, and the 2022 bear market, the checks continued. Its payout has grown roughly 7% year over year recently, with approximately 5.7% annual growth over five years. A 21-year monthly track record through every major market event of the era deserves genuine respect — and it gets it here. PEY's elimination is simple: at 0.54% per year — nine times the benchmark's fee — it charges too much for an income level that comparable funds deliver at a fraction of the cost. Out on cost alone.
DGRW: The Smallest Check That Passed First
The WisdomTree U.S. Quality Dividend Growth Fund (DGRW) carries the smallest trailing paycheck in the entire test: roughly $1,400 per year on $100,000, or about $117 per month. For most income investors, that number ends the conversation before it begins.
It should not. DGRW has paid monthly since May 2013 — thirteen years of consecutive checks. It charges just 0.28%, the lowest fee of all twelve funds. Its distribution has compounded at approximately 12% per year over the past decade, growing from roughly $1.16 to $1.23 per share in recent years, while the fund itself has compounded at roughly 13% annually since inception. Real income, honestly small. Lowest cost in the test. Thirteen years of monthly payments with double-digit distribution growth behind them. Three for three. This is what proven looks like when it does not advertise.
The Covered Call Crowd: QYLD, KNG, GPIX, and GPIQ
Four funds, four different answers to the same question: how much of tomorrow's growth are you willing to trade for this month's income? The entire group went zero for four.
QYLD: The Clearest Shrinking Paycheck in the Test
The Global X Nasdaq-100 Covered Call ETF (QYLD), dating to 2013, is the longest-running index covered call fund in the country. Its strategy — selling at-the-money call options on essentially the entire Nasdaq-100 each month — converts nearly all of the index's upside into cash premium. The trailing twelve-month distribution rate is 11.58%, which on $100,000 translates to approximately $966 per month at a 0.60% fee. One of the biggest real monthly paychecks in this entire test.
The durability record is unambiguous: over five years, QYLD's distribution has declined at -4.33% per year. Over ten years, it is essentially flat at -0.04% per year. A paycheck shrinking at 4% annually while a household's fixed expenses grow is a compounding problem, not a footnote. QYLD is not a broken fund — in a strong recent market, its total return including distributions was roughly 21.3%. It works exactly as designed. What it is designed to do is trade future income growth for present income size, and question three is income durability. Out.
KNG and the Goldman Newcomers
The First Trust Dividend Aristocrats Covered Call ETF (KNG) pairs companies with multi-decade dividend raise streaks with a covered call overlay — in theory, the best of both worlds. In practice, its pure income distributions have fallen from roughly $1.52 to about $1.22 per share since 2022, with variable capital gains payments filling part of the headline gap. Gains cannot be planned around as a salary. At 0.74% per year, KNG carries the highest fee in the entire test. It fails on both income durability and cost.
Goldman Sachs' GPIX (S&P 500) and GPIQ (Nasdaq-100) are genuinely compelling by most measures: 0.29% net fees, stable monthly payments, and cumulative NAV total returns of over 22% and 28% respectively since inception. GPIQ's 10.5% target distribution rate — cited directly from Goldman's own page — sits nearly a full percentage point above the screener figure that circulated widely, a gap worth roughly $1,000 per year in expected income. Both funds were eliminated for one reason: they launched in October 2023. No bear market survived, no durability proven. That is a verdict on evidence, not quality. Revisit them in a few years.
The Final Four: IWMI, QQQI, SPYI, and DIVO
IWMI and QQQI: The Strongest Young Funds
The Neos Russell 2000 High Income ETF (IWMI) carries the largest advertised distribution rate in the entire test at 14.38%, implying nearly $1,200 per month on $100,000. It launched in May 2024. The biggest promised paycheck backed by the shortest proof is precisely what the durability filter exists to catch. Eliminated on track record.
The Neos Nasdaq-100 High Income ETF (QQQI) is the most impressive young fund in this analysis. Its trailing twelve-month distributions on $100,000 actually delivered approximately $13,700 — roughly $1,139 per month, the single largest real paycheck in the entire test. Its cumulative NAV total return since inception exceeds 50% (approximately 18% annualized), and over the past year its NAV rose roughly 16% while paying out all of those distributions. The paycheck has not been eating the fund. But QQQI launched in January 2024. No 2022 on its record, no completed three-year window. Eliminated narrowly, respectfully, and probably temporarily.
SPYI: Double-Digit Income with a Rising Share Price
The Neos S&P 500 High Income ETF (SPYI) launched August 29, 2022 — directly into the tail end of a bear market — and its partial first year finished down just ~2.5%. Since then it has built three full years of live, public, monthly payment history. The issuer's published distribution rate as of end-July is 12.04%, and the trailing twelve-month rate is 11.94% — two figures that nearly agree, which is itself a mark of consistency in this category. At 0.68% and over $11 billion in assets, SPYI delivered approximately $11,600 over the trailing year on $100,000 — roughly $965 per month — without a single missed payment.
SPYI's three-year total return since launch: approximately +77%. In three full years through a bear market tail, it has never missed a monthly payment. Its NAV is rising, not melting.
The core lesson from SPYI is that covered call ETF NAV erosion is not a law of nature — it is a function of structure. SPYI writes its S&P 500 options in a way that preserves room for upside and manages the trade with tax awareness. Three years of live data confirm the approach has produced principal growth alongside a double-digit distribution. On the three-question framework: real income confirmed at approximately $965/month, cost reasonable at 0.68%, durability documented through three years that included a bear market tail. Three for three. Two honest caveats: three years is the minimum bar for proof, not a decade — SPYI still has to earn its next storm. And its distributions include return of capital by design, a detail worth examining at tax time.
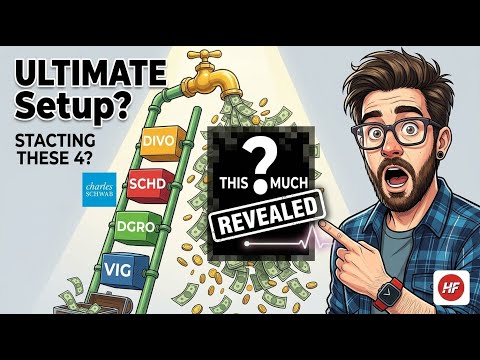
For investors building a layered monthly income approach, the 4-ETF dividend ladder framework shows one practical way to structure income sources across funds with different risk and payout profiles.
DIVO: The Most Proven Monthly Paycheck on the List
The Amplify Enhanced Dividend Income ETF (DIVO) pays the second-smallest check in this test — roughly $400 per month on $100,000, at a 4.82% issuer distribution rate and a 0.56% fee. Launched in December 2016, it may be the strongest fund in this entire analysis.
DIVO is not built like other covered call funds. It owns a hand-selected basket of dividend growth companies and writes covered calls tactically on individual positions — only when the premium is genuinely worth capturing. Most of the portfolio, most of the time, is simply compounding in quality businesses. Options are a yield enhancer, not the engine of the strategy. That structural difference explains everything that follows.
The five-year comparison makes the case directly: QYLD's five-year distribution growth is -4.33% per year. DIVO's is +12.25% per year. Two covered call funds, two completely opposite income trajectories. In 2022, while growth funds were collapsing, DIVO finished the year down just 1.46% — the mildest decline of any covered call fund in this test. With distributions included, it outperformed JEPI by approximately 26 percentage points over five years, with no NAV erosion. Over five years it compounded at roughly 11% annually; over three years, closer to 16%.
DIVO belongs in the income layer of a diversified portfolio — a complement to a core holding, not a replacement for one. The 3-Bucket Dividend Strategy using DIVO, NOBL, and SCHD explores in detail how it fits as an income layer within a retirement framework. On the three-question test: real income at $400/month confirmed, cost fair at 0.56%, and durability — nine years of monthly payments through every major market disruption since 2016, with a distribution growing at 12.25% per year. Full marks. The most proven monthly paycheck on this list.
Final Scoreboard: What the Three Winners Share
Three funds passed: DGRW, SPYI, and DIVO. Nine failed. Four were too young. Two — JEPI and JEPQ — are excellent income-now vehicles that trade future growth for present cash by design, a fit question rather than a flaw. PEY charges too much for the income it delivers. QYLD and KNG have paychecks moving in the wrong direction.
What the three winners share is not a common payout rate. DGRW pays $117 per month while SPYI pays $965. What they share is that none advertised the biggest number, all produced a verifiable payment history through at least one market downturn, and all delivered income without quietly consuming the principal behind it.
The three-question filter — real trailing income, honest all-in cost, and proven durability through a storm — will outlast every specific figure in this analysis. Apply it to any monthly dividend ETF, and the question is no longer which fund carries the highest advertised rate. The question is which fund has earned the right to be believed.
Watch the Full Video Analysis
The complete fund-by-fund breakdown — including exact trailing distribution calculations, month-by-month payment histories, and the direct comparison between QQQI and GPIQ running the same Nasdaq-100 index with different engines — is covered in the video below. The visual walkthrough makes the covered call mechanics and durability scoring significantly easier to follow.
Watch: I Tested 12 Monthly Dividend ETFs With $100,000 — Only 3 Passed
Nothing in this article constitutes financial advice. All figures reflect data from mid-August 2026. Distributions change monthly, and past payouts never guarantee future ones. Always verify current numbers before making any investment decision.