- Key Takeaways
- The Architecture of the Climb
- Phase 1: The Foundation — Milestones 1–4 ($0 to $25,000)
- Phase 2: The Acceleration — Milestones 5–8 ($25,000 to $250,000)
- Phase 3: The Income Years — Milestones 9–12 ($250,000 and Beyond)
- The Behavior Behind All 12 Milestones
- Watch the Full Video Walkthrough
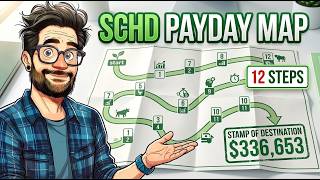
At the payout rates published in August 2026, a portfolio of $336,653 generates exactly $1,000 a month in dividends without selling a single share. That number is not a guess — it falls from a specific blend of three published fund payouts, and it marks the tenth rung on a twelve-rung ladder that begins with $100. This article maps the complete path from zero to living off dividends: three phases, twelve milestones, and the precise dollar figure and fund pivot that unlocks each one.
The fund you start with is not the fund you retire on. The plan evolves at $10,000, $100,000, and $250,000 — and knowing when it evolves is worth more than any single ticker.
Key Takeaways
- Three phases govern the climb: Foundation (VTI and SCHG, $0–$25,000), Acceleration (DGRO and VIG, $25,000–$250,000), and Income Years (SCHD, DIVO, and SGOV, $250,000 and beyond)
- At today's blended payout of roughly 3.6%, generating $1,000 a month in dividends requires approximately $336,653
- The fund you start with is not the fund you retire on — the plan pivots at $10,000, $100,000, and $250,000
- The $100,000 milestone is the plan's most critical trigger: stop feeding the growth blend and redirect new contributions to DGRO and VIG
- DIVO carries a 4.82% distribution rate and a 1.51% 30-day SEC yield simultaneously — both figures are accurate, and understanding the difference is essential
- Sequence-of-returns risk is the quiet threat to income portfolios; a cash floor built from SGOV is the structural defense
The Architecture of the Climb
Most dividend investing content focuses on which fund to buy. This plan focuses on when the fund changes — because the sequence of pivots determines the outcome far more than any individual ticker. The twelve milestones divide into three chapters with distinct objectives. The Foundation chapter builds mass while forming a durable investing habit. The Acceleration chapter lets compound interest take on the heavy lifting while the portfolio is upgraded twice. The Income Years chapter converts accumulated mass into a growing, defensible income stream. Across all three chapters, the underlying behavior — automatic contributions, reinvested dividends, no panic selling — never changes. The funds evolve three times. The behavior never changes once.
Phase 1: The Foundation — Milestones 1–4 ($0 to $25,000)
The foundation phase is not about picking winning funds. It is about building the machine that makes every later milestone possible.
Milestones 1 and 2: The First $100 and Automation
The opening fund is VTI, Vanguard's total U.S. stock market ETF — roughly 3,500 companies in a single ticker at a cost of 0.03% per year. Its yield hovers near 1%, which is deliberately modest at this stage. The purpose of the first $100 is not income; it is identity. On a $100 balance, even a strong year returns about $10. What the first hundred purchases is the habit of ownership — and the mindset shift from planning to invest to actually doing it.
The second milestone is a system decision, not a fund decision. Setting up an automatic transfer of even $50 per week — timed to payday so investing happens before spending gets a vote — removes willpower from the equation. At $500 a month, $1,000 arrives in two months. At this balance, a 10% market crash erases exactly one monthly contribution. Savings rate is the market at this stage, which is a strength: the habit forms while the stakes are small.
Milestones 3 and 4: $10,000, SCHG, and the First Reinvestment Loop
At $500 a month with a conservatively hedged 9% annual return — deliberately below the generous returns of the past decade — the $10,000 milestone arrives in roughly 19 months. This is also the plan's first fund evolution: new contributions shift to a 70/30 split between VTI and SCHG, Schwab's large-cap growth ETF. SCHG concentrates in the largest U.S. growth companies at a cost of 0.04% per year. Over the last decade it returned approximately 18% annually — an unusually generous stretch powered by a concentrated set of technology winners that no projection should treat as permanent. Its yield is roughly 0.4%. The fund is here for mass, not income, and it is explicitly temporary: the plan is renting its growth to build the base the income years will eventually draw from.
At $25,000, the foundation is complete and a quieter mechanism activates. The first meaningful dividend lands — perhaps $50 for the quarter — and is automatically reinvested in new shares. Those shares begin paying dividends of their own. Research from Hartford Funds found that approximately 85% of the S&P 500's cumulative total return since 1960 came from reinvested dividends and the compounding they created. At the 70/30 blend's payout of roughly 0.8%, $25,000 generates around $200 a year — trivial today, but the flywheel is running.
Phase 2: The Acceleration — Milestones 5–8 ($25,000 to $250,000)
The acceleration is the longest chapter in years and the most important in dollars. Compound interest takes on increasing weight, and the portfolio is upgraded twice.
Milestone 5: $50,000 and the Drawdown Test
No new fund enters at $50,000. This milestone is a behavior test. Somewhere between $25,000 and $50,000, most investors encounter their first serious drawdown. At this balance, a 2% down day moves the account by $1,000 — which may exceed an entire month's contribution. In 2022, the total U.S. market fell approximately 25% from its peak and did not fully recover in nominal terms until early 2024. An investor who froze contributions when headlines turned negative and one who kept $500 a month flowing through the entire decline finished that two-year stretch on very different footings, because every dollar contributed during the drop purchased shares at a discount. Milestone 5 is crossed not by reaching the balance, but by watching a red month and changing nothing.
Milestone 6: The $100,000 Pivot to DGRO and VIG
At $100,000, new contributions stop flowing to the growth blend and begin flowing to two dividend growth funds: DGRO and VIG, split evenly. DGRO (iShares Core Dividend Growth ETF) holds approximately 400 companies at 0.08% per year with a yield near 2% and historical dividend growth of 7–9% annually. VIG (Vanguard Dividend Appreciation ETF) restricts its roughly 340 holdings to companies with at least ten consecutive years of dividend increases, at 0.04% per year, with a yield near 1.5% and similar dividend growth. The pairing is deliberate: DGRO casts a wider net and leans toward current yield, while VIG demands a decade of proven consistency, so the two funds tend not to stumble on the same company names during a market downturn.
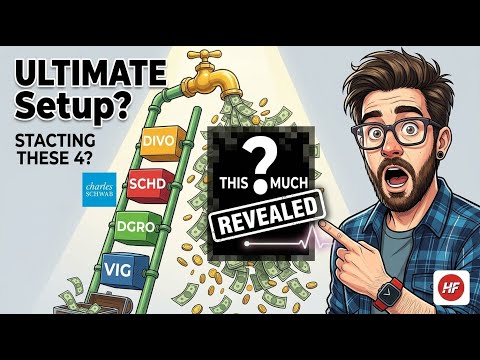
The math behind the pivot is direct. An investor at $100,000 who keeps $500 a month flowing for ten more years on the pure growth blend could reach roughly $373,000 with annual dividends near $3,100. The same investor who redirects all new dollars into the DGRO/VIG mix could reach roughly $390,000 with dividends near $6,900 per year at today's yields — potentially rising to approximately $14,800 annually if the funds' blended 8% historical dividend growth held for the decade. Same contributions, same decade, more than four times the income. For a detailed look at how these four funds work in a real portfolio, see 4-ETF Dividend Ladder: How VIG, DGRO, SCHD & DIVO Pay $613/Month.
Milestones 7 and 8: The First $100 Dividend Month and the Summit
On the pure growth blend — with its payout near 0.8% — a $100 monthly dividend requires approximately $144,000 invested. At a $500/month contribution pace, that moment arrives around year 13 of the journey. Once DGRO and VIG are absorbing new contributions, three forces push income upward simultaneously: fresh contributions on every payday, reinvested dividends buying additional shares, and the companies inside those funds raising their own payouts roughly 8% per year. The first $100 month feels slow because only one engine is turning at the start. Once all three run together, income growth curves rather than climbs in a straight line — and the second $100/month arrives years faster than the first did.
The full arc from zero to $250,000 takes approximately 17 years at $500/month and conservatively hedged returns: about 19 months from zero to $10,000, close to nine years from $10,000 to $100,000, and under seven more from $100,000 to $250,000. The rungs accelerate as compounding carries more of the load.
Phase 3: The Income Years — Milestones 9–12 ($250,000 and Beyond)
Everything before this chapter built the mountain. This chapter turns the mountain into a river. Three funds enter, each with one defined job, and the milestones stop measuring portfolio value and start measuring what it pays.
Milestone 9: SCHD — The Income Anchor
SCHD (Schwab U.S. Dividend Equity ETF) does not appear earlier in this plan by design. The fund holds approximately 100 companies screened for cash flow, dividend consistency, and balance-sheet strength at a cost of 0.06% per year. Its yield sits just above 3%, though the figure moves with price — the fund was quoted anywhere from 3% to nearly 4% within a single week in August 2026. Over the last decade, SCHD returned approximately 12.8% annually with dividends reinvested while growing its payout roughly 10.6% per year. When the market fell approximately 25% in 2022 and growth funds shed close to a third of their value, SCHD's quality screens meant it fell far less and continued raising its dividend through the downturn.
SCHD is not the highest-yielding fund in the market. It is arguably the fund with the most defensible yield — one that has historically survived recessions intact while continuing to raise its payout. From $250,000 onward, SCHD becomes the core position, receiving new money and gradually redirected dividend income. For a direct comparison of SCHD's dividend growth trajectory against DGRO, see DGRO vs SCHD: The Dividend Growth Stall Investors Need to See.
Milestone 10: $1,000 a Month and the Distribution Rate Distinction
At $336,653, a portfolio of 60% SCHD, 25% DIVO, and 15% SGOV produces $1,000 a month at today's payouts. The blended yield across the three positions is approximately 3.6%. The arithmetic: $12,000 in annual income divided by 3.6% equals $336,653. This is the machinery behind every honest answer to the question of how much portfolio is needed to live off dividends — annual income need divided by a real blended yield from real published payouts.
DIVO (Amplify Enhanced Dividend Income ETF) requires a specific clarification before entering any portfolio. As of July 2026, its issuer reports a distribution rate of 4.82% and a 30-day SEC yield of 1.51% for the same fund in the same month. Neither figure is inaccurate. DIVO earns much of its payout by selling covered call options on the quality dividend stocks it holds. Options income is not classified as dividend income under SEC accounting rules, so it appears in the distribution rate but not in the 30-day yield. The correct term for DIVO's income is always distribution rate. The fund costs 0.56% per year and returned approximately 10.7% annually over the last five years versus roughly 12.9% for the S&P 500. It trails the market on purpose, trading upside for smooth monthly cash flow. Its role is capped at 25% of the income mix: a booster, not an anchor.
Milestone 11: SGOV, the Cash Floor, and $2,000 a Month
SGOV (iShares 0–3 Month Treasury Bond ETF) holds approximately 24 ultra-short government securities at a cost of 0.09% per year and pays monthly. Its share price barely strays from $100. Its SEC yield sat near 3.5% in August 2026 — the same fund yielded above 5% in 2023 and drifted lower as the Federal Reserve cut rates. SGOV has averaged under 3% annually since inception and is not a growth vehicle; it is a structural floor.
One to two years of core living expenses held in SGOV means that in a bad market year, bills are paid from the floor's monthly interest while equity positions remain intact. Every income plan that omits this piece is one bear market away from being forced to sell shares at depressed prices. At the blended 3.6% payout, $2,000 a month requires approximately $673,000. A worked example at $600,000 — $360,000 in SCHD, $150,000 in DIVO, $90,000 in SGOV — produces roughly $10,900, $7,200, and $3,200 per year respectively, totaling approximately $21,400 annually or about $1,780 per month at current rates. Held for ten years with SCHD's dividend growth conservatively hedged at 7% and the other two positions flat, that income could reach approximately $32,000 per year.
Milestone 12: The Crossover Moment
At the blended 3.6% payout, covering $3,000 in monthly core expenses — housing, food, utilities, and insurance — requires just over $1,000,000. The precise figure at current rates is $1,009,959, though the honest frame is a range: SCHD's yield alone moved from 3% to nearly 4% within a single week in August 2026, and every tick shifts the required balance by tens of thousands of dollars. If monthly core expenses are $2,000, the required portfolio drops below $700,000. The mountain is exactly as tall as the lifestyle it must fund.
The risk most income projections overlook is sequence of returns. A portfolio being drawn from is far more fragile in a market decline during its early income years than the same portfolio was during accumulation, because selling shares near a market bottom converts a temporary decline into permanent damage. Two retirees who earn the same average return over ten years but encounter a sharp decline at different points can finish decades apart in how long their money lasts. The SGOV floor is the structural defense: in a bad year, bills are paid from its monthly interest while SCHD and DIVO continue paying on shares that were never sold.
The Behavior Behind All 12 Milestones
Three phases. Three fund evolutions. One constant. The funds changed at $10,000, $100,000, and $250,000. The behavior — contribute automatically on payday, reinvest every dividend, sell nothing during periods of fear — never changed across any of the twelve rungs. The tickers are replaceable. The behavior is the strategy. Whatever the next milestone is, it is the only one that matters.
Watch the Full Video Walkthrough
For a visual walkthrough of all 12 milestones — including the live yield calculations behind the $336,653 figure, the side-by-side comparison of the growth and dividend paths at the $100,000 pivot, and the full sequence-of-returns illustration — watch The Complete Path From $0 to Living Off Dividends on the Harry's Financial Fitness YouTube channel.
This article is for educational purposes only and does not constitute financial advice. All returns and yields cited are historical figures as of August 2026 and are not guarantees of future performance. Every yield referenced will drift from the time of publication. Always conduct your own research and consult a licensed financial professional before making any investment decisions.