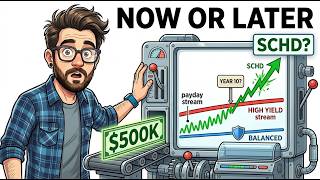
The model that hands you the biggest dividend check in year one is not the one that pays the most income twenty years later. That counterintuitive gap is the central question every retirement investor faces, and it plays out with striking clarity when you model the same $500,000 three completely different ways: a growth model built on SCHD, DGRO, VIG, and DGRW; a high yield model built on HDV and SPYD; and a balanced model built on VOO, VYM, and an SGOV cash floor. Same starting capital, three philosophies, and three very different outcomes at the end of the timeline.
Key Takeaways
- The high yield model (HDV + SPYD) generates approximately $17,900 in year-one income — nearly $7,000 more than the growth model's $10,900
- The growth model's dividend income compounds at roughly 8% annually; the high yield model's income grows at under 3%
- The growth model historically overtakes the high yield model's income at around year 10 and continues pulling ahead
- By year 20, the growth model is projected to pay an estimated $40,000 annually versus the high yield model's mid-$20,000s
- The balanced model trades some income for an SGOV cash floor that prevents forced selling during market downturns
- All three blends cost between 4 and 9 basis points annually — a fraction of the 1% advisor fee that can drain over $100,000 in wealth across 20 years
Ground Rules for This Comparison
All three models start with the identical $500,000 in capital. Every yield, cost, and growth rate referenced comes from current fund data, cross-checked across sources. Blended dividend growth rates are held steady at what each strategy has historically delivered — a modeling assumption, not a guarantee. Dividend growth rates shift, yields move, and markets do not compound in straight lines. Treat every projection here as an illustration of historical behavior, not a prediction of future results, and not as financial advice. Your own tax picture, timeline, and risk tolerance require the judgment of you or a qualified professional.
One macro note worth holding: the Federal Reserve has maintained rates through 2026 rather than cutting. That matters because the fattest yields in the market are often tied to short-term rates. Even this summer, one high-distribution income fund cut its monthly payout roughly in half in a single announcement. The funds modeled here are more established and diversified than that example — but the underlying lesson holds. A large yield is only as valuable as its durability.
The Growth Model: SCHD, DGRO, VIG, and DGRW
The growth model allocates $500,000 across four funds: 40% to SCHD, 25% to DGRO, 20% to VIG, and 15% to DGRW. Every fund is built around companies that not only pay a dividend but raise it consistently. The blended starting yield is approximately 2.2%, producing roughly $10,900 in year-one income — the smallest opening check of the three models. But the defining characteristic is not the check size. It is the slope.
SCHD, the largest allocation, yields approximately 3.11% at just 6 basis points in annual expenses, with five-year dividend growth near 9% per year. A dividend growing at 9% annually roughly doubles in eight years without adding new capital. DGRO, at 25%, yields about 1.88% at 8 basis points with five-year dividend growth near 7%, and it screens out the ultra-high yielders that tend to disappoint. VIG, at 20%, yields approximately 1.48% at just 4 basis points — the lowest-cost fund in the model. Its quarterly dividend has increased for over 20 years with no cuts and no skips, including through the 2008 financial crisis and the 2020 pandemic crash. DGRW, the final 15%, yields about 1.26% at 28 basis points and pays monthly. Its ten-year dividend growth reads around 12%, though much of DGRW's total return has come from price appreciation rather than a steadily climbing dividend — it functions more like a quality total-return fund with a dividend growth identity.
Blended across all four positions, the growth model has historically raised its income at approximately 8% per year. At that rate, income roughly doubles in nine years without adding a dollar of new capital. Because the underlying companies are growing earnings, the principal has historically appreciated alongside the income rather than being drawn down to fund each paycheck. The trade-off is patience: a smaller check early in exchange for a materially larger one, and a larger nest egg, later. For a closer look at how two of the core holdings in this model have historically compared on dividend growth, see DGRO vs SCHD: The Dividend Growth Stall Investors Need to See.
The High Yield Model: HDV and SPYD
The high yield model is structurally simple: 50% to HDV and 50% to SPYD. The blended starting yield is approximately 3.6%, producing roughly $17,900 in year-one income — nearly $7,000 more per year than the growth model from day one. For an investor who needs current cash flow, that gap is not abstract. It is a mortgage payment. It is real, and the high yield model genuinely wins that specific race.
HDV yields approximately 3.1% at 8 basis points, holding a concentrated basket of large, established, cash-generating companies in energy, healthcare, and consumer staples. Its top holdings make up more than a quarter of the entire fund. Its five-year dividend growth rate is approximately 1.9% annually — the other end of the universe from the growth model's 8%. SPYD yields approximately 4.1% at 7 basis points, equally weighting roughly 80 of the highest-yielding large U.S. companies. Its per-share payout has been uneven — roughly half of its quarterly adjustments have been cuts and half increases — with five-year dividend growth around 3.7%.
Blended, the model starts at $17,900 and grows at approximately 2.8% per year. The check is large, but it barely climbs. The principal tends to hold roughly flat rather than appreciating with earnings. For a retiree who needs maximum income starting this year, this model genuinely wins that race. The critical question is what that large opening check costs over a 20-year horizon — which is exactly where the next section begins.
The Balanced Model: VOO, VYM, and SGOV
The balanced model allocates 50% to VOO, 35% to VYM, and 15% to SGOV, with each holding serving a distinct function. VOO yields approximately 1% at just 3 basis points — the cheapest fund in this entire comparison. Its low yield is by design: VOO is the growth engine, present to grow principal through the compounding earnings of the largest American companies, not to generate immediate income. VYM, at 35%, yields approximately 2.2% at 4 basis points with five-year dividend growth near 3.8%. Holding hundreds of established dividend payers, it provides broad, stable income exposure — the income anchor of the model.
SGOV, the final 15%, holds ultra-short-term Treasury bills at 9 basis points with a current yield of approximately 3.8%. That yield is rate-linked — it will fall if the Fed cuts rates, and it should not be treated as a permanent income figure. SGOV earns its place for a different reason: the cash floor. Treasury bills do not fall with equities. In a sharp market drawdown, this allocation holds its value, allowing the investor to draw spending cash from SGOV rather than selling VOO or VYM shares at depressed prices. Preventing forced selling near a market bottom is one of the most consequential protections a retirement portfolio can have — and one of the hardest to rebuild once lost.
The blended starting yield is approximately 1.9%, producing roughly $9,300 in year-one income — the smallest opening check of all three models. In exchange, the investor receives a strong growth engine, a diversified income anchor, and a crash-proof spending reserve. Income grows at a moderate pace historically between the other two models, and the ride is smoother than either. The model trades some income at both ends of the timeline for durability and calm.
The Crossover Point: When Growth Income Catches High Yield
The crossover is the moment two income streams — which start nearly $7,000 apart — finally meet. The high yield model begins at $17,900 and grows at approximately 2.8% annually. The growth model begins at $10,900 and grows at approximately 8% annually. Every year, the gap narrows. Running those growth rates forward, the growth model's rising income historically catches and passes the high yield model's income at approximately year 10.
That crossover year can shift by a year or two depending on the exact growth rates that hold in any given period — this is an illustration built on historical behavior, not a fixed calendar date. But the direction is unambiguous. Once the growth model's income crosses over, it does not slow down. It keeps compounding at 8% while the high yield model crawls at under 3%. The crossover concept — and how it applies to broader retirement income planning — is explored further in Dividend Crossover Point: When Passive Income Replaces Your Salary.
The 20-Year Verdict: Which Model Wins?
By year 20, under historical growth rates, the growth model would be generating approximately $40,000 in annual income. The high yield model, having climbed slowly from its $17,900 start, would be paying closer to the mid-$20,000s. The model that started $7,000 per year behind finishes approximately $14,000 per year ahead — and does so while the principal has historically grown rather than held flat. The growth model wins the late income race and the net worth race simultaneously.
The balanced model never contends for the highest income figure at either end. What it delivers is the smoothest path and the crash-proof floor. An investor who lived through a sharp drawdown near retirement without being forced to sell at the bottom experienced something the income numbers alone cannot quantify — and the SGOV floor is what makes that possible.
The single most important variable in this comparison was not the starting yield. It was the growth rate of the income. A large number growing slowly loses, over enough time, to a smaller number growing quickly.
One figure connects all three models: the cost. Every blend costs between 4 and 9 basis points annually. A 1% advisor fee on $500,000 is $5,000 per year regardless of market performance. Over 20 years, that drag can represent on the order of $100,000 in foregone wealth — a near-certain cost that dwarfs the differences between any of these three strategies.
Three verdicts, clearly stated: if you need the most income today, the high yield model wins — and the trade-off is slow income growth. If you have time and want both income and principal to grow, the growth model historically wins the long race, overtaking high yield income around year 10 and pulling away from there. If the priority is a steady ride with a buffer that eliminates forced selling, the balanced model wins on durability and calm. No model is universally superior. Each wins a specific goal.
For a full visual walkthrough of all three models — including year-by-year income trajectories, the exact crossover moment, and the 20-year principal comparison — watch the complete breakdown: $500,000 in Dividends: Growth vs High Yield vs Balanced Over 20 Years. The visual format makes the convergence between models and the long-run divergence significantly easier to follow.