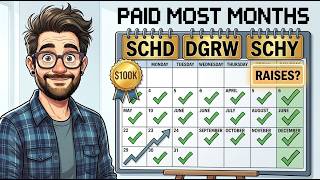
A $100,000 investment in a high-yield fund paying 8% delivers roughly $8,000 in year one. That is a real, compelling number. But there is a question most income investors never ask: what does that check look like in year ten? If the payout never grows — or gets cut — the math shifts dramatically. The alternative explored here is a three-ETF dividend portfolio built around SCHD, DGRW, and SCHY: a stack designed to raise its own paycheck, year after year, without requiring a single additional dollar of capital.
Key Takeaways
- A $100,000 split evenly across SCHD, DGRW, and SCHY generates approximately $2,500 in year-one income at a blended yield near 2.5%.
- SCHD has raised its per-share dividend every year since launching in 2011 — roughly 14 straight years of increases, maintained through the 2020 crash and the 2022 rate spike.
- DGRW pays monthly, filling the calendar gaps between SCHD's quarterly distributions, and has historically grown its dividend near 12% annually over the past decade.
- SCHY adds international diversification at a yield of approximately 3.3%, an element most three-fund income portfolios skip entirely.
- Based on historical dividend growth rates, this rising paycheck stack could roughly double its income stream by year ten — reaching an estimated $5,500–$5,600 per year on the same shares, with no new capital added.
- Running this portfolio independently costs approximately $140 per year in blended fees, versus roughly $1,000 per year for a typical 1% advisory fee on the same balance.
Why a Rising Paycheck Beats a Flat 8% Yield
The appeal of a high-yield fund is easy to understand. Eight percent on $100,000 is $8,000 — more than most dividend growth strategies deliver in several years combined. The problem is that elevated payouts are rarely built to grow. Many rely on covered calls, options income strategies, or concentrated sector exposures that make the yield structurally fragile. Over the past year, several popular monthly income products cut their distributions by 25% to more than 50%, even while their share prices held steady. The check arrived every month, but it shrank.
The dividend crossover point — the moment a rising income stream catches and surpasses a flat one — is the central logic behind this portfolio. Under historical dividend growth assumptions, the three-fund rising paycheck stack catches a flat $8,000 annual payout at roughly year 15, and could cross sooner (around year 13) against a modestly lower flat check. Every year after the crossover, the gap widens in favor of the rising build.
The Three-ETF Stack: How Each Fund Earns Its Role
Each of the three funds serves a distinct purpose. None is interchangeable. Together, they create an income stream that arrives nearly every month, raises itself over time, and costs almost nothing to maintain.
SCHD: The Anchor
The Schwab US Dividend Equity ETF (SCHD) is the foundation. It currently yields approximately 3.11%, which on a $33,000 position produces just over $1,000 per year. The expense ratio is 0.06% and the fund holds over $100 billion in assets — one of the largest dividend funds in the country. SCHD pays quarterly.
What earns SCHD the anchor role is its dividend growth track record, not its yield. The fund has raised its per-share dividend every year since launching in 2011, roughly 14 consecutive years of increases sustained through both the 2020 market crash and the rate-driven turbulence of 2022. Historically, SCHD has grown its dividend at roughly 10.6% per year over the past decade and approximately 9% annually over the past five years. Past raises are not a guarantee of future results, and any fund can experience a flat or down year. A 14-year record of consistent increases through two significant market disruptions is precisely the behavioral consistency that belongs at the center of a long-term income plan.
DGRW: The Monthly Raiser
The WisdomTree US Quality Dividend Growth ETF (DGRW) solves a structural calendar problem: SCHD pays quarterly, leaving eight months with no income deposit. DGRW pays every month, converting the portfolio from a sporadic income source into one that delivers a deposit in nearly every calendar month.
DGRW's current yield is approximately 1.26%, producing around $400 per year on a $33,000 position. Its expense ratio is 0.28%, and it holds roughly $17 billion in assets. On those numbers alone, it appears to be the weakest component. The historical dividend growth rate tells a different story: DGRW has grown its dividend at approximately 12% per year over the past decade, a pace that historically doubles a payout in roughly six years.
An important caveat applies here. DGRW's five-year dividend growth rate is substantially lower, approximately 4.4%, indicating that recent years have been bumpier than the longer-term record implies. The fund has had down years. The accurate description is a genuine long-run monthly raiser with meaningful year-to-year variability — lower starting yield, historically larger raises over time, but not a smooth ride in every period.
SCHY: The International Lift
The Schwab International Dividend Equity ETF (SCHY) addresses the gap that nearly every three-fund income portfolio ignores: international exposure. The fund holds dividend payers across the United Kingdom, France, Switzerland, Australia, Germany, and other developed markets — companies with established histories of paying dividends in their home countries.
SCHY yields approximately 3.3%, slightly above SCHD, with an expense ratio of 0.08% and roughly $2.5 billion in assets. On a $33,000 position, it contributes approximately $1,000 per year. The fund pays quarterly.
Transparency requires acknowledging the fund's limits. SCHY launched in 2021, meaning it lacks even five full years of operating history. Its dividend growth record is too short to draw confident conclusions from. There is also a modest tax consideration: dividends from foreign companies may be subject to withholding taxes in their country of origin before reaching the investor, which can reduce effective yield, particularly in taxable accounts rather than tax-advantaged retirement accounts. SCHY earns its place in this stack for diversification and international yield lift, not for a proven long-run growth record it has not yet had the time to build.
What $100,000 Actually Generates: Three Scenarios
Year-One Income and the Payment Rhythm
With $100,000 split evenly — approximately $33,000 into each fund — the blended yield lands near 2.5%, producing roughly $2,500 in year-one income, or just over $200 per month on average.
The calendar structure reveals the portfolio's design logic. DGRW deposits something every single month. In the quarterly payment months — approximately March, June, September, and December — SCHD and SCHY pay alongside DGRW, creating a noticeably larger combined deposit. The result is a consistent rhythm: modest monthly payments in most months, with substantially larger combined paydays four times per year. This cadence is structurally similar to a dividend ladder approach, where staggered payment schedules are engineered to produce a near-monthly income flow from quarterly-paying funds.
The Ten-Year Projection
The long-term case depends on dividend growth compounding over time. If SCHD continued raising its payout near its historical rate of approximately 9% per year, DGRW grew at a conservative middle estimate of roughly 8% per year, and SCHY contributed proportionally, the $2,500 starting income could roughly double over a decade — reaching an estimated $5,500 to $5,600 per year on the same shares, with no new capital added. These projections are based on historical dividend growth rates and are not a guarantee of future results.
Against a flat 8% product paying $8,000 annually with no growth, the rising build trails substantially in year one. But the flat check never increases. The rising build closes the gap year by year, potentially crossing the flat $8,000 check near year 15 — or around year 13 against a modestly lower flat payout — and extending its lead indefinitely after that point. For investors who need income to last 20 or 30 years, the question is not which portfolio pays more today, but which one pays more for the duration.
The Fee Advantage
Blending the three expense ratios equally — 0.06% for SCHD, 0.28% for DGRW, and 0.08% for SCHY — produces a portfolio-level cost of approximately 0.14%. On $100,000, that is roughly $140 per year to run the full stack independently.
A financial advisor charging 1% on the same balance costs approximately $1,000 per year. The $860 annual difference stays invested and compounds alongside the portfolio. Projected over 20 years at a reasonable rate of return — which is not guaranteed — that fee gap alone can accumulate to tens of thousands of dollars in additional portfolio value. The cost structure is a meaningful, compounding advantage of self-directed implementation.
Watch the Full Video Breakdown
For a visual walkthrough of the payment calendar, the crossover chart, and the step-by-step fee comparison, watch the complete video on YouTube: This 3-ETF Stack Turns $100,000 Into a Rising Monthly Paycheck. The video covers each scenario in detail and includes the exact numbers behind the ten-year income projection and the crossover timeline between the rising build and a flat high-yield alternative.
This article is for educational purposes only and does not constitute financial advice. Past dividend growth rates are not a guarantee of future performance. Tax treatment varies by account type and individual circumstances. Always consult a qualified financial professional before making investment decisions.