- Key Takeaways
- How the Income Was Measured
- 2008 to 2011: The Only Real Test of Dividend Income
- 2015 to 2020: The Fast Crashes and Dividend Cuts in COVID
- 2022 to 2026: Rates, Tariffs and Where Payouts Stand Now
- What Eighteen Years of Dividend Crashes Say
- How to Plan Around Dividend Cuts
- Watch the Full Video
On March 9, 2009, one share of DVY, the iShares Select Dividend fund, was worth 63% less than it had been seventeen months earlier. Over the following year, though, that same share paid only about 31% less income than the year before. Most investors remember the price chart from 2008. This article follows the other line, the income, and tracks what one share of VIG, VYM, DVY, PEY and the S&P 500 (SPY) actually paid through every crash since, plus SCHD from 2011.
It is a model, not a real brokerage account. Every payment comes from each fund's published distribution history, adjusted for share splits, and every price is a published daily close. It is educational only, not financial advice, and past performance does not guarantee future results.
Key Takeaways
- In 2008, dividend ETFs fell by roughly half or more, yet most of them paid more that year. The cut came in 2009.
- In 2009, VIG's payout fell less than 5%, SPY's about 20%, VYM's about 19%, DVY's about 31% and PEY's about 37%.
- A modelled $100,000 split across VIG, VYM and DVY saw its income fall once in eighteen years, by about a fifth, and it was back above its old level by 2012.
- In COVID, 69 S&P 500 companies cut or suspended dividends, yet the index still paid a record, and VIG, VYM and SCHD payouts rose.
- The worst income crash of the last 18 years would have needed a cash cushion of only about half a year of income.
How the Income Was Measured
For each crash, the study found the day each fund's price hit bottom. It then added up the last four payments before that day and compared them with the next four payments after it. If the next four came in lower, the income was cut. If they came in higher, it held. The study also looked at every calendar year from 2007 to today, to show slow moves as well as sudden ones.
The funds tracked are VIG (the dividend growers), VYM (Vanguard High Dividend Yield), DVY (the iShares high yielders), PEY (Invesco High Yield Dividend Achievers) and SPY as the yardstick. SCHD, the Schwab U.S. Dividend Equity fund, joins the record from late 2011, when it launched. There have been seven crashes in the window: the financial crisis, the 2011 debt-ceiling scare, the 2015-16 oil and China slide, the end of 2018, COVID, the 2022 rate-hike bear market and the April 2025 tariff drop.
The question a retiree actually asks in a crash is not what the account is worth, but what it is going to pay.
2008 to 2011: The Only Real Test of Dividend Income
The price fell hard
From the October 2007 peak to the March 9, 2009 bottom, the S&P 500 fund fell about 56.5%. VIG fell about 48%, VYM about 59%, DVY about 63%, and PEY about 74%. Dividend ETFs do fall in a crash, and some fell harder than the market. A retiree who put $100,000 into VIG, VYM and DVY, a third in each, at the end of 2007 saw the account worth about $46,700 on that day.
The year the checks went up
During 2008 itself, most payouts rose. VIG paid about 17.5% more per share than in 2007, VYM about 6% more, DVY about 2% more, and even the S&P 500 fund paid slightly more. Most companies set dividends ahead of time and boards hate to cut, so many were still paying out of 2007's profits. The price reacts in a day; the income line reacts in a year. The modelled retiree collected about $2,800 in dividends in 2008.
That lag cuts both ways. Income holds up while the headlines are at their worst, but when a cut comes, it arrives after the crash, when everyone has stopped watching.
2009: the cut
According to S&P's own figures, S&P 500 companies paid about 21% less per share in 2009 than in 2008. By one count based on S&P data, 62 companies cut or suspended their dividend in 2008, and 78 did so in 2009. Calendar 2009 against 2008, here is how each fund's payout landed:
- S&P 500 fund: down about 20%
- VYM: down about 19%
- DVY: down about 31%
- PEY: down about 37%
- VIG: down less than 5%
DVY's quarterly payment peaked at about 68 cents a share in March 2008 and was down to about 40 cents by September 2009, a 42% drop payment to payment. The three-fund retiree's dividends fell from about $2,800 in 2008 to about $2,200 in 2009, roughly a fifth of the income.
Why some funds broke and others bent
DVY and PEY pick companies largely by how much they pay, and in 2007 some of the biggest dividends in America came from banks and other financials, exactly the companies that cut or stopped paying. VIG requires at least ten consecutive years of dividend raises and ignores yield size, so it held more steady growers with cash left over after paying out.
Ned Davis Research has tracked U.S. stocks by dividend behavior since 1973. Through the end of 2025, companies that grew or started dividends returned about 10.2% a year, while those that cut or eliminated them lost about 1% a year. In recessions alone, cutters lost about 23% a year against about 2.5% for growers.
What happens to your income in a crash is mostly a question of what is inside the fund. A high yield is usually a sign of where the stress will show up first. That does not make DVY a bad fund; it owns what it says it owns.
How long the income took to recover
VIG's payout was back above its 2008 level in 2010, one year, while its price did not regain its peak until August 2012. VYM's payout fell two years in a row (2009 and 2010) and got back above 2008 in 2012, the same year as the S&P 500 fund. DVY's price regained its peak in February 2014, but its payout did not clear the 2008 level until 2015, seven years. PEY's price recovered in June 2016 and its payout in 2017. For the two high yield funds, price recovered before income.
The three-fund retiree's income went from about $2,800 to about $2,200 in 2009, about the same in 2010, about $2,500 in 2011 and about $2,975 in 2012. It never fell again in any calendar year, and in 2025 those shares paid about $7,000, two and a half times the 2008 check. Total shortfall below the 2008 level was about $600, $590 and $280 over three years: about $1,470, roughly half of one year's income spread across three years.
The same $100,000 in the S&P 500 fund hit almost the same low, about $46,600. But its income started lower, about $1,860 in 2008, fell to about $1,490 in 2009, and reached about $5,000 in 2025 against about $7,000 for the three-fund mix. The dividend funds did not protect the price; they paid more from the first year onward.
The summer 2011 debt-ceiling scare was a first look at the pattern to come. Prices fell 15 to 19% in a few weeks, yet the next four payments rose on every fund: about 16% for the S&P 500 fund, 9% for VIG, 12% for VYM and 8% for DVY. Prices were back near their peaks in about five months.
2015 to 2020: The Fast Crashes and Dividend Cuts in COVID
Oil, China and the end of 2018
In the second half of 2015, with oil collapsing and China devaluing its currency, the S&P 500 fund fell about 14%, VIG about 12.5%, VYM about 14%, DVY about 11% and SCHD about 14%. Yet the next four payments were flat for VIG, up about 6% for VYM, 8% for DVY, 7% for SCHD and 8% for the S&P 500 fund.
From late September to Christmas Eve 2018, the S&P 500 fund fell about 20% and the dividend funds between about 17 and 18%. Payouts rose anyway: VIG about 5%, VYM about 7%, DVY about 13% and SCHD almost 20%. VIG's price was back to its September peak by late April. A crash driven by fear, not by companies running out of money, barely touches the income line.
COVID: 69 companies cut, and the index still paid a record
From mid-February to March 23, 2020, the S&P 500 fund fell about 34% in roughly five weeks. VIG fell about 32%, VYM about 35.5%, DVY about 41% and SCHD about 33%. This time companies really did stop earning. According to S&P Dow Jones Indices, 27 S&P 500 companies cut their dividend in 2020 and 42 suspended it, 69 in total, more than in 2008. By the end of June, S&P had already counted 62 decreases, 41 of them suspensions.
Even so, the S&P 500 fund's next four payments came in only about 4% lower, and the index as a whole paid a record, about $58.28 per index share. DVY dipped about 2% and PEY about 1%, while VIG's next four payments rose about 8%, VYM's about 10% and SCHD's about 18%.
S&P Dow Jones Indices found that from 2019 to 2020, 29 companies in its S&P 500 High Dividend Index cut, making up about 36% of that index's weight. In its High Yield Dividend Aristocrats Index, built on 20 or more years of raises, cutters were only about 7% of weight. As in 2009, cuts come from the highest yields first.
A paycheck through the crash
Take a retiree with $500,000 at the end of 2018, half in VIG and half in VYM, spending every dividend and never selling. In 2019 the shares paid about $14,600. On March 23, 2020 the account was worth about $423,000. The checks then ran about $15,200 in 2020, $16,700 in 2021, $18,000 in 2022, $19,300 in 2023, $19,800 in 2024 and $20,300 in 2025, a raise every year. The unsold shares are now worth about $1.1 million. This is one start date and two funds in a strong market, and a 2022 start would show a flatter line, but it shows what the income line is for.
2022 to 2026: Rates, Tariffs and Where Payouts Stand Now
2022: the slow bear market
From January to the fall low, the S&P 500 fund fell about 25%, VIG about 21.5%, VYM about 17.5%, and DVY and SCHD about 19%. Income still rose. The next four payments were up about 10% for VIG and DVY, 6% for SCHD, 4% for VYM and 5% for the S&P 500 fund. For the full calendar year, SCHD paid about 14% more per share than in 2021, VIG about 12%, DVY about 8%, VYM about 5% and the S&P 500 fund about 10.5%.
The real cost was the wait. SCHD did not regain its January 2022 peak until July 2024, 21.5 months. DVY took almost 23 months and VIG about 16. For nearly two years the income was the only part of the account that kept rising. It does not stop the price from falling; it gives you a reason not to sell while you wait.
April 2025: the tariff drop
From the February peak to April 8, 2025, the S&P 500 fund fell about 19%, VIG and VYM about 15%, DVY about 14% and SCHD about 15%. Here the growers were honest about a small miss: VIG's next four payments came in about 3% below the prior four and VYM's about 5% below, not because companies cut but because quarterly payments bounce around (VIG paid an unusually large check in March 2025 and a smaller one in March 2026). For calendar 2025, VIG still paid about 5% more per share and VYM was up a fraction of a percent. DVY's next four were about 8% higher and SCHD's about 1.5% higher.
The income line in 2026
Comparing each fund's first three payments of 2026 with the same period of 2025: VIG is up about 3%, VYM about 7%, DVY about 5.5%, the S&P 500 fund about 5.5% and SCHD about 1%. SCHD's line is the flattest, its second near-flat year in four after 2023, though it has never had a calendar-year cut and its payout grew about 10.5% a year over ten years. Readers weighing SCHD against other growth-focused options may find this comparison of DGRO and SCHD useful.
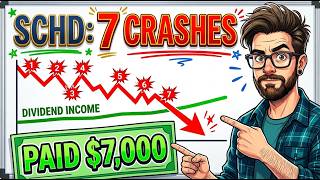
SCHD's full crash record since 2011 is short and clean: in 2015 price down about 14%, income up about 7%; in 2018 price down about 18%, income up about 20%; in 2020 price down about 33%, income up about 18%; in 2022 price down about 19%, income up about 6%; in 2025 price down about 15%, income up about 1.5%. Five crashes, five rises. It has never been through a 2009, though, and nobody can promise how it would do.
What Eighteen Years of Dividend Crashes Say
In 2008, prices fell by roughly half or more and payouts rose. In 2009, payouts fell about a fifth for a mixed portfolio, a third for high yielders and about 5% for growers. In 2011, 2015 and 2018, every payout held or rose. In 2020, high yield lines dipped a few percent while VIG, VYM and SCHD got raises of roughly 8 to 18%. In 2022 every payout rose. In 2025 income went mostly sideways. The income line fell seriously once, in the one crash where companies themselves ran out of money, and even then far less than price.
Risks that could make the next one worse
- Concentration: DVY still holds about a quarter of its money in financials and about another quarter in utilities, according to recent fund snapshots.
- A slow squeeze: income can keep rising and still lose ground if raises trail inflation, as in flat years like 2023 or 2026.
- A prolonged earnings collapse: 2008 was the only crash where any fund's payout fell by more than about 5%.
How to Plan Around Dividend Cuts
First, plan for one bad year. If 2009 happened again, a mixed dividend portfolio could pay about a fifth less for a year or two. Scale the $1,470 shortfall to a $40,000-a-year dividend income and it comes to about $21,000 spread over three years, roughly half a year of income. A cushion of about half a year's income in cash or Treasury bills would have carried that retiree through the worst income crash of the last eighteen years without selling a share.
Second, know which line you own. Growers bent; high yielders broke in the one crash that mattered. That is not a reason to avoid them, but a reason not to rely on them alone for income you cannot do without. Third, watch the lag: the year after a crash is the year to keep cash on hand, not to spend every check. Fourth, income lets you sit still. The people who sold missed the recovery, and those living on the checks never had to sell.
For ways to combine these funds, see this 4-ETF dividend ladder with VIG, DGRO, SCHD and DIVO.
Watch the Full Video
For the year-by-year charts and the full fund-by-fund ledger, watch the video 18 Years of Holding Dividend ETFs Through Every Crash Since 2008. The next video in the series, I Lived on Dividends for 12 Years - Here's the Brutal Truth, covers the spending side of the same story.
Every figure here comes from a model built on published prices and distributions over one particular eighteen-year window. I'm not a financial advisor and this isn't financial advice. Do your own research, because the next crash will not follow the last one's script.