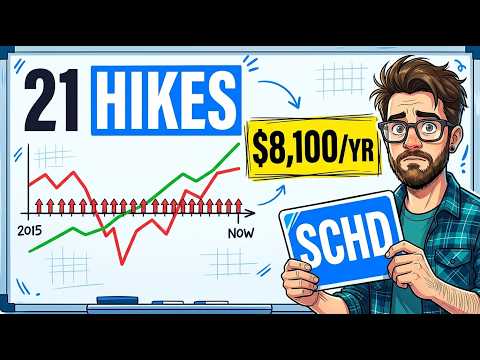
A modelled $100,000 dividend portfolio lost about $136,000 to a single sell order on one Monday in March 2020. That is the headline from a ten-year back test of dividend ETF investing mistakes. The test started in January 2016 and used published prices and payouts for SCHD, VOO, VIG, DGRO, SPYD, HDV, JEPI and SGOV. It was then repeated twelve times, each time with one very normal investor decision, and every decision got a dollar price tag.
None of this happened to a real brokerage account. It is one modelled investor, $100,000 and the data. That makes the twelve mistakes comparable side by side. Together they form what the video calls the Expensive Ladder, running from about $170 at the bottom to about $136,000 at the top.
Key Takeaways
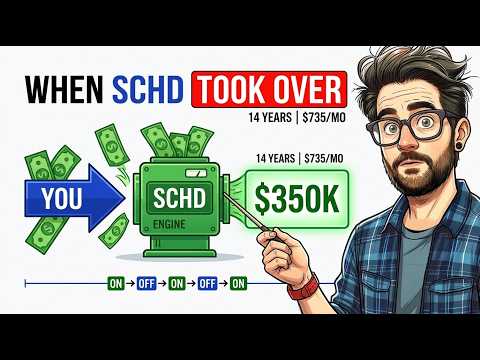
- The baseline, $100,000 in SCHD with every dividend reinvested and nothing sold, grew to about $370,000 over the ten years to September 25, 2026.
- The twelve lessons range from about $170 (buying just before the ex-dividend date) to about $136,000 (panic selling in March 2020 and waiting to feel safe).
- None of the twelve required a bad fund. Every fund did what its label says, and the cost came from what the investor asked it to do, and when.
- The most expensive mistakes were about being out of the market while it recovered, or choosing a fund for its yield instead of its growth.
- These are back tests on one ten-year window. Past performance does not guarantee future results, and this is educational, not financial advice.
How the Dividend ETF Back Test Works
The starting line is the close on the last trading day of 2015. The finish line is the close on Friday, September 25, 2026. Every price is the published closing price, adjusted for share splits, and every dividend is the fund's own published payout. Reinvested dividends buy shares at that day's closing price. Any money sitting in cash earns the Treasury bill rate of the day, which is more generous than many brokerage cash accounts.
The baseline is $100,000 in SCHD, the Schwab U.S. Dividend Equity ETF, with every dividend reinvested. Today it is worth about $370,000, and almost every lesson below is measured against that number. An earlier video on this channel used illustrative round numbers. This one uses what the funds actually did, which is why a couple of the answers were surprising.
The Cheap Rungs: Lessons 1 to 4
The first four mistakes are the ones almost everyone makes early. They are small, common and quiet, and none of them needs a market crash.
Lesson 1: Buying before the ex-dividend date (about $170)
SCHD went ex-dividend on September 23. On September 22 it closed at $33.74, so $100,000 bought about 2,960 shares. The payment of 26.65 cents a share came to about $790. On the ex-dividend date the share price is marked down by roughly the size of the payment, so nothing was gained. In a taxable account, selling inside the 60-day holding window means the payment is taxed as ordinary income. At a 22% bracket that is about $170. The bigger cost is the habit of treating the dividend as the prize. A dividend is a piece of your shares handed back as cash, not a gift on top of them.
Lesson 2: Putting the income fund in the wrong account (up to about $4,000)
Take $50,000 in a taxable account and $50,000 in a Roth IRA. JEPI, the JPMorgan Equity Premium Income ETF, pays mostly options income that has typically been taxed as ordinary income. Since June 2020, $50,000 of JEPI paid about $29,700 in distributions. Taxed at 22%, that is roughly $6,500 of tax. The same $50,000 in SCHD paid about $16,700, and at the 15% qualified rate the bill is about $2,500. Swapping which fund sits in which account is worth up to about $4,000, and it costs nothing to do. The exact split between ordinary and qualified income shifts each year, so confirm it on your year-end tax form. For more on tax placement, see our breakdown of how a pause in dividend ETF investing costs real money.
Lesson 3: Paying 0.50% for something that costs 0.06% (about $17,000)
SCHD charges six basis points a year. Many actively managed dividend funds charge fifty or more for a very similar basket. Taking an extra 44 basis points a year out of the baseline cuts the ending value by about $17,000. No statement ever shows a line for this fee. It comes out a sliver at a time and compounds against you the way dividends compound for you. Check the expense ratio before you check the yield.
Lesson 4: Chasing last year's winner (about $34,000)
Each January, the investor moved the entire position into whichever of five dividend ETFs had the best total return the year before. The five were SCHD, VIG, DGRO, SPYD and HDV. The result was about $335,000, roughly $34,000 less than holding SCHD throughout. The timing explains it. SPYD had a huge 2016, so the chaser bought it for 2017, a year SCHD beat it by about eight percentage points. HDV was the only one of the five to rise in 2022, so the chaser rode it through 2023, when it gained less than 2%.
There is a twist. Moving the whole SCHD position into VOO at the end of 2023, after SCHD's flat year of about 4.5%, would have left you about $60,000 ahead. That switch earns no price tag because it made money. It worked because of the three years that followed, not because switching works. This year SCHD is up about 24% against about 14% for VOO, and leadership keeps moving.
The habit is what costs money, not any single switch. Choose a fund for the job it does, not for the year it just had.
The Quiet Rungs: Lessons 5 to 8
These four do not feel like mistakes while you are making them. You are still invested and still collecting income. The price only shows when you compare the result with the investor who did less.
Lesson 5: Taking dividends as cash while still building (about $40,000)
With every dividend reinvested, the SCHD position owns about 11,100 shares today. With dividends taken as cash, it still owns roughly 7,800 shares, even after crediting the cash with Treasury bill interest. The gap is about $40,000. Last year the reinvested version paid just over $11,000 in dividends and the cash version just over $8,000. SCHD's payout per share grew from about 42 cents in 2016 to about $1.05 last year, adjusted for its split, a little over 10% a year compounded. Reinvesting stacks those raises on a growing share count. This is the same compounding logic behind our guide to the dividend crossover point.
Lesson 6: Selling in the slow slide of 2022 (about $64,000)
In 2022 VOO finished down about 18% and SCHD down about 3%. From its closing high on January 11 to its low on September 30, SCHD's price still fell about 19%, taking the modelled portfolio from roughly $256,000 to about $213,000. The investor sold on September 30 and moved into SGOV, the iShares 0-3 Month Treasury Bond ETF. They bought back on July 17, 2024, when SCHD climbed back above its January 2022 high, almost 22 months later. That portfolio is worth about $305,000 versus $370,000 for holding. They sold at the bottom and bought back about 24% higher. The payout per share kept rising the whole time, so the income never fell. Only the price did.
Lesson 7: Waiting in cash for a better price (about $65,000)
An investor in January 2016 waited for a pullback, holding Treasury bills that averaged about a third of one percent in 2016 and a little under 1% in 2017. The dip finally came in late 2018, and they bought SCHD on December 24, 2018. By then the $100,000 had grown to about $103,000, but SCHD's price was about 15% higher than at the start of 2016. The portfolio is worth about $304,000 today versus $370,000. A dip only helps if it falls below the price you could have paid today, and over this decade it mostly did not.
Lesson 8: Swapping growth for income too early (about $76,000)
In June 2020 the SCHD position was worth roughly $155,000 when the investor moved everything into JEPI and reinvested the distributions. JEPI is a great income tool, and the income delivered. Last year it paid about $22,000 against about $11,000 for the SCHD version. But JEPI's price went from about $51 to $56.76, up about 11%, while SCHD's price rose about 90%. The JEPI version is worth about $294,000 against $370,000. If both investors had taken cash instead, the gap widens to about $82,000. The mistake is not owning JEPI. It is buying the income stage of life while still in the growth stage.
The Expensive Rungs: Lessons 9 to 12
Lesson 9: Moving everything to T-bills and SGOV at 5% (about $80,000)
At the end of 2022, Treasury bills paid about 5% through 2023, while SCHD yielded about 3.4%. The investor moved about $245,000 into SGOV on the last trading day of 2022. SGOV returned about 18% over the next nearly four years, leaving about $290,000. SCHD's dividend rose from about 85 cents a share in 2022 to about $1.05 last year, and holding it is worth about $370,000. SGOV's trailing yield is now about 3.7%, so the 5% was only ever as good as the next rate decision. A T-bill's yield is its whole return, while a dividend growth fund's yield is only where the return begins. A cash floor for emergencies or the next year or two of spending is still sensible.
Lesson 10: Choosing the bigger first check (about $98,000)
HDV, the iShares Core High Dividend ETF, paid about $3,700 on $100,000 in its first year. DGRO, the iShares Core Dividend Growth ETF, paid about $1,900. DGRO's payout per share nearly tripled from 2016 to 2025, while HDV's rose by less than half. In 2025 DGRO paid about $5,600 and HDV about $5,300. Spending every payment, HDV delivered about $6,900 more in total. But the HDV shares are worth about $193,000 against about $298,000 for DGRO, a gap of about $105,000. Netted out, the bigger first check cost about $98,000. For more on this comparison, read our DGRO vs SCHD analysis.
Lesson 11: Buying the highest yield on the screen (about $112,000)
SPYD, the SPDR Portfolio S&P 500 High Dividend ETF, holds the eighty highest-yielding S&P 500 companies, equally weighted. Its first-year payout was about $5,300 against about $3,300 for SCHD. With reinvesting, SPYD paid more than SCHD in seven of the first eight years, and about $82,000 in total over the decade against about $75,000. Then 2020 hit. SPYD finished down about 11.5% while SCHD finished up about 15%. SPYD's distribution per share fell almost 30% in 2021, while SCHD raised its payout every year of the decade. In 2024 SCHD paid about $10,200 against about $9,400 for SPYD, and has stayed ahead since.
The SPYD version is worth about $257,000 against $370,000, a gap of about $112,000, more than the original investment. SCHD's share price rose about two and a half times since January 2016, SPYD's about one and a half times. A high yield is a price, not a gift, so ask what it is the price of.
Lesson 12: Selling the crash and waiting to feel safe (about $136,000)
On January 23, 2020, SCHD closed at a high and the modelled portfolio stood at about $173,000. By the close on Monday, March 23, it was worth about $115,000. The investor sold every share at the lowest close of the crash, when the price was only about 2% above its January 2016 start. They then waited in Treasury bills, which earned about $70 over eight months, until November 9, 2020, when SCHD closed above its January high. That day the same money bought back only about 5,700 shares instead of the roughly 8,700 sold, because the price was about 54% higher. About a third of the position was gone for good.
That portfolio is worth about $233,000 against $370,000, a cost of about $136,000. A gentler version, selling on March 12 when the fund first closed more than 20% below its high, still costs about $112,000. SCHD's 2020 payout per share was higher than 2019's. The income never fell. The shares you own on the worst day are the shares that recover for you, and selling turns a temporary price drop into a permanent share count.
Morningstar's Mind the Gap study found the average dollar earned 8.7% a year over the ten years to the end of 2025, while the funds returned 9.9%. That gap of about 1.2 percentage points a year comes from when people bought and sold.
What the Expensive Ladder Teaches
The cheap lessons were about paperwork, fees, taxes and a dividend date. The expensive ones were about decisions: being out of the market during a recovery, or asking a fund to do a job it was never built for. The investor who paid the most was not reckless, just careful at exactly the wrong moment. The one who ended with the most made no brilliant move, and avoided all twelve. For a broader look at pairing funds by job, see the SCHD and SCHG core-satellite strategy.
Watch the Full Video Walkthrough
Want to see every back test on screen? Watch the full video, 10 Years of Dividend ETF Investing - The 12 Lessons That Cost Me the Most Money, on YouTube at
This article is educational and is not financial advice. All figures are back tests on published history, I am not a financial advisor, and past performance does not guarantee future results. Always do your own research.