- Key Takeaways
- A Decade-Long Experiment: $100,000 Into SCHD Before the First Hike
- Chapter One: The Slow Hiking Cycle (2015–2018)
- Chapter Two: The Fast Hiking Cycle (2022–2023)
- Chapter Three: The 2026 Hike and What Changed
- The Full Ledger: 21 Hikes Later
- SCHD vs. Treasury Bills vs. VOO
- What the September 2026 Hike Means for You
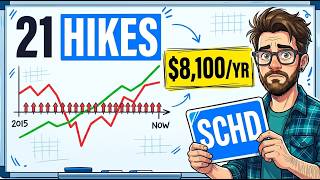
A modelled $100,000 placed into SCHD, Schwab's U.S. Dividend Equity ETF, on December 15, 2015 — the day before the Federal Reserve's first hike of the current era — now pays about $8,100 a year without a single dividend reinvested or a single new dollar added. That number is the end point of a ten-year experiment: tracking the same block of shares through 21 Fed rate hikes, several cuts, and two separate stretches where the share price fell close to 20% from its high. The price and the paycheck did not move together, and the gap between them is the real story behind this SCHD dividend history.
Key Takeaways
- A modelled $100,000 in SCHD from December 15, 2015 bought about 7,712 shares and now pays roughly $8,100 a year in cash, up from about $3,200 in the first full year, 2016.
- Both major hiking cycles (2015–2018 and 2022–2023) pushed SCHD's share price down close to 20% from its high, yet the dividend rose in every single calendar year regardless of whether the Fed was hiking or cutting.
- The worst price decline of the entire decade, roughly 21%, happened during rate cuts in 2019–2020, not during a hike.
- 2023 delivered the slowest dividend growth in the fund's history at 3.8%, while 2022 — the most aggressive hiking year — delivered one of the fastest, at roughly 14%.
- After the September 16, 2026 hike, SCHD's trailing distribution yield (about 3.2%) sits below SGOV's SEC yield (about 3.67%) for new buyers, even though a 2015 holder is earning roughly 8% to 11.5% on their original cost.
- With every dividend reinvested instead of spent, the position grew to about 11,113 shares worth roughly $369,000, now paying about $11,500 a year.
A Decade-Long Experiment: $100,000 Into SCHD Before the First Hike
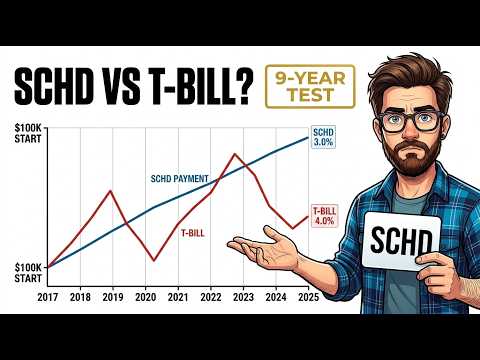
The position is modelled, not a real account, built from split-adjusted closing prices on Yahoo Finance and the distribution amounts Schwab publishes for the fund. On December 15, 2015, SCHD closed at roughly $12.97 a share in today's split-adjusted terms (the fund split 3-for-1 in October 2024), buying about 7,712 shares with the $100,000. At that close, SCHD's trailing twelve-month distribution yield was just under 3%, while a 3-month Treasury bill paid about a quarter of one percent and the 10-year Treasury sat near 2.25%. SCHD's yield was roughly twelve times what cash paid. The next afternoon, the Fed raised its target range for the first time in this cycle, to 0.25%–0.50%. Five days later, the fund went ex-dividend and paid its first check, about $700, before the new rate had done anything to anyone.
Chapter One: The Slow Hiking Cycle (2015–2018)
The first cycle ran three years and nine quarter-point hikes, taking the Fed's range from near zero to 2.25%–2.50% by December 2018. In 2016, the lone-hike year, individual quarterly payments actually dipped — June and September payments were smaller than the prior year's — but the full year still paid about $3,230, up roughly 10% per share, while the share price rose 12% to about $14.50. In 2017, three hikes did nothing to slow the fund: the price climbed about 31% to $17.06, the payout rose about 7% to $3,460, and the same $100,000 rolled in 3-month bills earned about $930 in interest, three times the year before.
2018 is where the two ledgers split apart for the first time. The share price peaked on January 26 at about $18.19, then fell through the year's final quarter to close at roughly $14.74 by Christmas Eve, five days after the cycle's ninth and final hike — a decline of about 19% from the high. Counting dividends, SCHD lost about 5.5% for the year, slightly worse than VOO's 4.5% loss, in a broad market sell-off rather than a dividend-fund problem. The dividend ledger had its own scare: the March 2018 payment came in about 20% below March 2017. But the rest of the year made up the difference, and the full-year payout still rose about 7%, to roughly $3,700. Across the whole first cycle, the share price rose about 20% (32% with dividends reinvested), the per-share payout climbed from about $0.38 to $0.48 a year, and 3-month bill interest on the same $100,000 rose more than sixfold, from roughly $300 to $2,000 — shrinking SCHD's 12-to-1 yield lead over cash to about 1.3-to-1.
The Twist: Cuts, Not Hikes, Caused the Worst Price Drop
Between the last 2018 hike and March 2022, the Fed cut rates five times and then held near zero for two years. The share price fell from about $18 to roughly $14.20 across that cutting stretch — down about 21%, and about 33% below its January high at the pandemic bottom in March 2020 — the single worst price decline of the entire decade, and it happened while the Fed was cutting, not hiking. The dividend ledger told the opposite story: 2019 paid about $4,430 (up nearly 20% per share) and 2020 paid about $5,220 (up almost 18%), the two fastest years of payout growth in this entire record, even as many U.S. companies suspended dividends outright. The subsequent two years near zero rates saw the price recover about 83% from its March 2020 low, while the payout grew another 11% in 2021 to about $5,780 — against roughly $35 of annual interest on the same $100,000 in bills.
Chapter Two: The Fast Hiking Cycle (2022–2023)
The fastest hiking cycle in roughly 40 years ran from March 2022 to July 2023: eleven hikes, four of them three-quarters of a point, lifting the Fed's range from near zero to 5.25%–5.50%. SCHD's price peaked January 11, 2022 at about $27.30 — two months before the first hike — and bottomed September 30 at about $22, down 19% on price and 17% with dividends. For the full calendar year, SCHD lost about 3.25% including dividends versus an 18% loss for VOO. The dividend ledger, meanwhile, had one of its best years: the full 2022 payout came to about $6,585, up nearly 14% per share and roughly $800 in dollar terms, the largest single-year raise the position had seen to that point.
2023 is the fund's weak year. Four more hikes, including the cycle's eleventh and final one on July 26, pushed the range to 5.25%–5.50%. The full-year payout grew only about 3.8% per share — the slowest full year of dividend growth in SCHD's history — a raise of roughly $250 after the prior year's roughly $800 raise. One quarter, June, actually paid about 5.5% less than June 2022. Across the whole fast cycle, the share price ended about 2% lower (up about 3% with dividends) while VOO gained roughly 9.5% over the same stretch, and SCHD's price did not reclaim its January 2022 high until July 2024.
The Yield Gap Headlines vs. the Real History
By the eleventh hike in July 2023, SCHD's trailing distribution yield was about 3.5% against a 3-month bill paying roughly 5.25% — a gap of nearly two full points, at least twice as wide as the roughly 0.5-to-0.9-point gap making headlines after the September 2026 hike. Yet the modelled 2015 position still paid about $6,800 that year, versus roughly $5,200 of interest on the same $100,000 rolled in bills — the best cash year in the entire record, and SCHD's paycheck still beat it. The yield that matters to a long-term holder isn't the one printed on the fund page; it's the payout divided by what they actually paid. For the 2015 buyer, that was about 6.8% in 2023, while the bill's 5.25% was the real story only for someone buying fresh that day.
Chapter Three: The 2026 Hike and What Changed
Six cuts between September 2024 and December 2025 took the Fed's range down to 3.50%–3.75%, and the share price barely moved — down about 1.5% across those fifteen months while VOO, with dividends, rose about 24%. Once the Fed paused, the price took off, rising about 24.5% in the following nine months. The dividend kept climbing regardless: 2024 paid about $7,700 (up 12% per share, and the year of the 3-for-1 split), and 2025 paid about $8,080 (up about 5%).
The Fed hiked again on September 16, 2026, a quarter point to 3.75%–4.00%, its first hike since July 2023. The share price fell about 1.4% that day and is down about 3.25% since (2.5% with dividends, partly reflecting a September 23 ex-dividend date), to about $33.21. The 10-year Treasury closed near 5.18%, well above the roughly 2.25% and 2.2% levels at the start of the prior two cycles. The September distribution, 26.65 cents a share, rose about 2.3% year over year — but the first three 2026 payments combined are up only about 0.8% on the same period in 2025, running behind even 2023's record-slow 3.8% pace. Whether the ten-year streak of rising annual payouts survives comes down to the December payment.
The Full Ledger: 21 Hikes Later
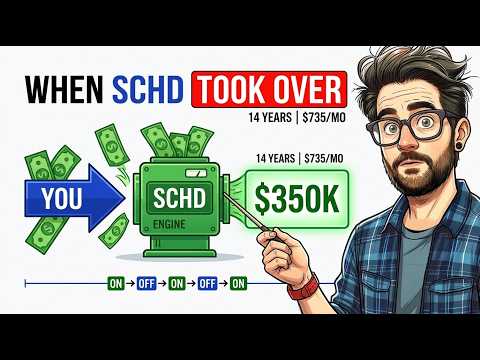
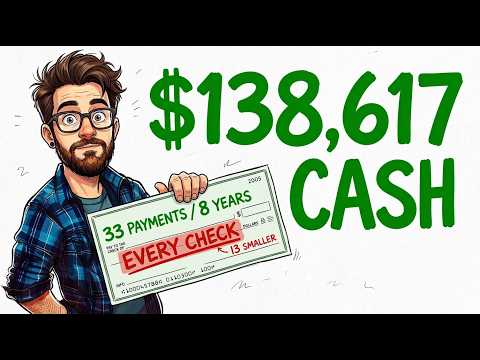
In the spend-everything version, the original 7,712 shares are now worth about $256,000 at the recent close, and have paid out roughly $61,700 in cash dividends along the way — a combined value of about $318,000 from the original $100,000. The annual paycheck rose from about $3,200 in 2016 to about $8,100 now, without the share count ever growing. Ranking all ten calendar years by payout growth shows no consistent link to Fed direction: the two fastest years (2019, 2020) came during cuts, the slowest (2023) came during hikes, but the third-fastest (2022) came during the most aggressive hiking year, and the second-slowest (2025) came during cuts. What is consistent is that all ten calendar years paid more than the year before, across every hiking cycle and every cut in between.
SCHD vs. Treasury Bills vs. VOO
The same $100,000 rolled in 3-month Treasury bills, interest spent, earned roughly $25,000 over the decade while the principal stayed intact; reinvested, it grew to about $128,000, with current income around $3,700–$4,000 a year — the only one of the three that moves in lockstep with the Fed. The same $100,000 in VOO with dividends reinvested grew to about $453,000, versus SCHD's reinvested total of about $369,000 — a roughly $84,000 growth edge for VOO, which readers comparing dividend growth strategies may also want to weigh against the findings in DGRO vs SCHD: The Dividend Growth Stall Investors Need to See. Both funds are simply doing different jobs. A separate correction from an earlier video: a prior analysis of SCHD's yield falling below a T-bill used an incorrect 2017 entry price near the mid-$20s; the corrected split-adjusted entry was about $14.60, yielding roughly 6,850 shares and a 2025 payment of about $7,200 — a 7% yield on cost rather than the originally reported 4.2%.
What the September 2026 Hike Means for You
For someone who has held since 2015, the hike changes little: their income runs at roughly 8% of original cost spent, or about 11.5% reinvested, against a bill paying around 4%. For a new buyer, the comparison has flipped since 2015. SCHD's trailing distribution yield is now about 3.2% (Schwab's own 30-day SEC yield was 3.15% as of September 24, 2026), while SGOV, the T-bill ETF, had a 30-day SEC yield of 3.67% on the same day — a small deficit where SCHD once held a 12-to-1 lead. For readers building a diversified income sleeve, the broader fund-flow trends covered in ETF Inflows Break Records in 2026: SCHD, VOO, and the $524B Flow Map add useful context on how money is positioning around this shift. The practical framework: money needed within twelve months belongs in a bill fund, not an ETF whose price has fallen close to 20% twice in this decade; income that comes from roughly 100 companies' own profits does not reprice the moment the Fed moves; and investors still building toward retirement should note that the reinvested ledger's $11,500 current payout came entirely from 44 payments compounding through all 21 hikes, not from timing an entry point.
The day before the first hike, SCHD paid about three percent and cash paid almost nothing. Ten years and twenty-one hikes later, cash has caught up with SCHD's quoted yield and passed it — but it still hasn't caught up with the paycheck.
For the full stop-by-stop walkthrough of every price swing and every dividend payment behind these numbers, including the side-by-side ledgers for each hiking cycle, watch the complete video breakdown on the HF channel for a visual look at how this decade actually played out.