- Key Takeaways
- What the 8-4-3 Rule Actually Says
- The Back-Test Method and the Three Funds
- Twenty Years of Real Data: Where the Rule Held and Where It Broke
- The Takeoff Year: When Dividend Income Starts to Climb
- How to Tell Where You Are: The Takeoff Test
- A Corrected 8-4-3 Rule
- Watch the Full Video Walkthrough
The 8-4-3 rule of compounding says the first eight years of investing are slow, the next four double your money, and the three after that add the same amount again. It has spread quickly through personal finance media, yet almost nobody has tested it against a real fund with a ticker. This article does that, running $500 a month through VIG, VYM and SCHD with every dividend reinvested. The most useful result was not about portfolio value. It was the year the dividend income took off: year eight, year nine and year thirteen, depending on the fund.
Key Takeaways
- At year eight, the rule's prediction of about $81,000 was right within about 5.5% for all three funds.
- At year twelve, all three funds fell short of the rule's $161,000 by roughly $14,000 to $23,000.
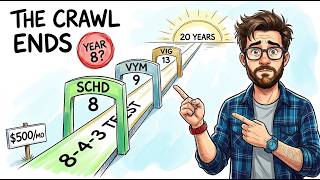
- The 'takeoff year' is the first year your dividends grow by more than one month of your contributions. It came in year 8 for SCHD, year 9 for VYM and year 13 for VIG.
- VIG built the biggest pile (about $473,000) but pays the smallest income of the three and took off last.
- Dividends alone matched a full year of contributions about five to six years after takeoff in every fund.
- A quick check: divide your last 12 months of dividends by your monthly contribution. Under about 4 is the crawl, 4 to 6 is the edge, and above 6 you are probably climbing.
What the 8-4-3 Rule Actually Says
You invest a fixed amount every month and assume 12% a year. The first eight years build your first block of money. The next four years build a second block of the same size, and the three years after that build a third. That is eight, four, three: fifteen years, three blocks.
At $500 a month, the rule's own arithmetic (one percent a month) gives about $81,000 at the end of year eight, about $161,000 at year twelve and about $252,000 at year fifteen. Those are the benchmarks every real fund was measured against.
The rule circulates almost entirely in Indian personal finance media as a rule of thumb for monthly investment plans. Groww, ICICI Direct and Standard Chartered's Indian arm all publish versions of it, and in March of this year the Economic Times ran a worked example of roughly 21,000 rupees a month growing to about 34 lakh by year eight, 68 lakh by year twelve and one crore by year fifteen. None of the sources checked name an originator or a first publication date, so the 12% figure has nobody standing behind it.
How Much of the Doubling Is Just Your Deposits?
Set the return to zero and keep depositing $500 a month. You have $48,000 at year eight and $72,000 at year twelve. With no growth at all, the pile still gets one and a half times bigger. That is not compounding, it is four more years of saving. So about half of the rule's year-eight-to-twelve doubling is simply you showing up every month, which makes the rule sturdier than it looks. For context, a Treasury bill fund like SGOV pays about 3.7% with almost no price movement, while the rule assumes more than three times that, every year, on a perfectly smooth line.
At lower returns the schedule bends more than it breaks. At 10% a year, the year-eight block is about $72,000, the doubling arrives around twelve and a half years and the tripling at about fifteen years and eight months. At 8%, the year-eight block shrinks to about $66,500, the doubling slips to almost thirteen years and the tripling to about sixteen and a half. At 8%, the rule becomes roughly an 8-5-3.5 rule. None of these versions include taxes, missed months or the order in which returns arrive.
The Back-Test Method and the Three Funds
This is a modelled back-test, not a real account. $500 goes in on the first trading day of every month, starting with each fund's first full month of trading. Every dividend is reinvested at the closing price on its ex-dividend date, with no taxes, no selling and no missed months. The funds' fees are already inside their prices. The data runs to the close on September 25, 2026, using published split-adjusted prices and distributions.
- VIG (Vanguard Dividend Appreciation ETF): launched April 2006, model starts May 2006. It owns companies with long dividend-raising records and yields only about 1.5% today.
- VYM (Vanguard High Dividend Yield ETF): launched November 2006, model starts December 2006. Its yield today is about 2.3%. Both Vanguard funds cost four basis points a year.
- SCHD (Schwab U.S. Dividend Equity ETF): launched October 2011, model starts November 2011. It has paid about 3.2% over its last four payments at today's price, and its payout has grown about 10.5% a year over the last decade.
One fairness note: the SCHD model starts after the 2008 crash, so it never had to sit through it. VYM and SCHD also share many holdings, so owning both gives more overlap than it appears.
Twenty Years of Real Data: Where the Rule Held and Where It Broke
The Crash the Rule Never Draws
From its peak on October 9, 2007 to its low on March 9, 2009, VIG fell about 47% with dividends counted. VYM fell about 57% over the same stretch, with its low on March 5. On March 9, 2009 the VIG account had received 35 contributions totalling $17,500 and was worth about $10,900, against a rule line of about $21,000. By its low, the VYM account had taken in $14,000 and was worth about $7,400.
The surprise was income. VYM's payout per share fell about a quarter between 2008 and 2010, from about $1.44 to about $1.09. Yet the model's dividend income rose from about $300 in 2008 to about $465 in 2009 and about $630 in 2010, because the account kept buying shares at crash prices. The VIG account was back above everything put into it by November 2009, and VYM by March 2010.
Year Eight: The Rule Was Right
The VIG model held about $76,300 at the end of April 2014. The VYM model held about $84,500 at the end of November 2014, above the rule. The SCHD model held about $79,200 at the end of October 2019. All three landed within about 5.5% of the rule's $81,000.
The reason is the crash itself. Contributions made in late 2008 and early 2009 bought shares at prices never seen again. VIG itself returned about 10% a year over this window, but the dollars in the monthly plan earned about 11.8%. VYM returned about 9.2% a year, while the plan's dollars earned about 11.5%. Across all three funds the plan's dollars earned roughly 11.5% to 12.5% a year, but for the two Vanguard funds part of that came from an early crash nobody should count on repeating.
Years Nine to Twelve: The Promised Doubling Fell Short
At year twelve the VIG model held about $139,000 (1.83 times its year-eight block), VYM about $147,000 (1.74 times) and SCHD about $138,000 (also 1.74 times). All three missed the rule's $161,000. The culprit was flat stretches. VIG and VYM stalled through most of 2015 and again at the end of 2018. SCHD had the most painful one: from late 2021 to late 2023, $12,000 went in and the balance rose only about $3,500.
VIG first doubled its year-eight block in August 2018 (twelve years four months in) and stayed above for good from February 2019. SCHD doubled in February 2024, also twelve years four months in. VYM took until December 2019, was pushed back under by the 2020 crash, and did not stay above until November 2020. The 'four' in 8-4-3 was really about four and a third years for two funds and more than five for the third.
Year Fifteen: A Lucky Rebound
The VIG model held about $249,700 at the end of April 2021, within about $2,500 of the rule's $252,000. But at the end of year fourteen it was at about $177,000 and grew about $73,000 in the next twelve months, only $6,000 of it new deposits. In mid-February 2020 the account was worth about $201,000, and by March 23 it had lost about $63,000 in five weeks. The rule landed only because a sharp crash and a fast recovery fell in years fourteen and fifteen.
VYM was not rescued. It held about $222,000 at year fifteen, 2.63 times its year-eight block, and first tripled that block in July 2023, sixteen years eight months in, much closer to the 8% version of the rule. SCHD is not yet fifteen years old, but it tripled its year-eight block in July of this year, fourteen years nine months in, and holds about $247,000 as of the September 25 close, of which only about a third is deposits.
The rule got the start right, the middle wrong for all three funds, and the end right for two of three. It got the path wrong every time.
The Takeoff Year: When Dividend Income Starts to Climb
The takeoff year is the first year your dividend income grows by more than one month of your contributions. At $500 a month, it is the first year your dividends pay you at least $500 more than the year before. The portfolio gives itself a raise bigger than a month of your saving, and the income line stops crawling and starts to climb. Plan years were measured in twelve-month blocks aligned with each plan's own years.
The Crawl
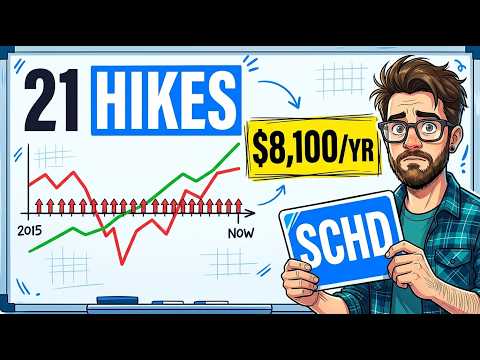
The first $1,000 a year of dividend income is the slowest money in the test. Measured on the last four payments, SCHD passed $1,000 in December 2016 (five years two months in), VYM in March 2012 (five years four months in) and VIG in December 2012 (six years eight months in). Then the steps shorten. SCHD's second $1,000 took two and a half years, the third a year and a half, the fourth another year and a half, and by its sixth thousand it was adding $1,000 of yearly income in about twelve months. That is the 8-4-3 pattern showing up in the income line, and it is steeper than the rule.
Where Each Fund Took Off
- SCHD, year 8: dividends of about $2,250 in the twelve months to October 2019, almost $600 more than the year before. Every year since has cleared the bar: about $610 in year nine, about $850 in year ten, more than $1,000 in year thirteen. About $110 of the first raise came from shares bought with that year's deposits.
- VYM, year 9: about $2,660 in the twelve months to November 2015, up about $530. It stumbled in year ten (a raise of about $310), then cleared $500 every year from year eleven through year eighteen, including almost $1,100 in year eighteen. The first takeoff was a false start.
- VIG, year 13: about $3,080 in the twelve months to April 2019, up about $540. Year fourteen's raise was under $100, but from year fifteen it cleared the line again, and year sixteen added about $1,000, the biggest raise in its history.
SCHD got there first because it paired a yield well above VIG's with the fastest payout growth of the three. A raise comes from three sources: the payout per share rising, reinvested dividends buying more shares, and new deposits.
VIG: The Patient One
The VIG model built the biggest pile, about $473,000 at the September 25 close, with only about a quarter of it deposited. Yet its last four payments add up to only about $7,000 a year, while the smaller VYM pile pays about $9,650. VIG yields about 1.5%, closer to VOO's roughly 1% than SCHD's roughly 3%. It has grown its payout about 7% a year over the last decade and about 9% a year over the last five, but growth on a small yield takes longer to become real dollars. The value compounds first and the income catches up later.
Both Vanguard models also saw their latest raise shrink: about $40 for VIG in the twelve months to April 2026 and about $150 for VYM in the twelve months to November 2025, as payout per share came in about 3% lower. Income still rose because the share count kept growing. Once you are past takeoff, most of your raise comes from payout growth, so one slow year is not a broken plan.
How to Tell Where You Are: The Takeoff Test
Each fund took off when its yearly dividends were around $2,000 to $3,000, which meant dividends covered roughly four and a half to six months of deposits. That gives a simple check: add up the dividends you were paid over the last twelve months and divide by your monthly contribution.
- Under about 4: you are still in the crawl, and that is normal.
- Between about 4 and 6: you are at the edge of your takeoff year.
- Above 6: you are probably already climbing.
This is a pattern from three funds over one stretch of history, not a law, but it is a better guide than the calendar.
Takeoff Is Not the Same as the Crossover
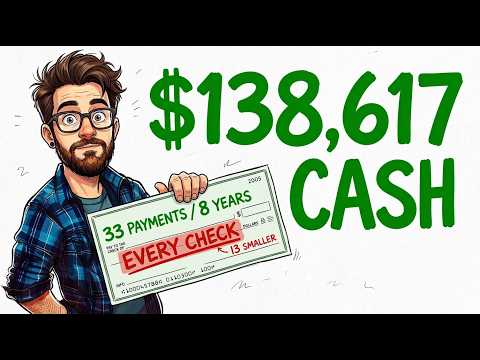
Dividends alone first matched a full year of contributions ($6,000) about five to six years after takeoff: SCHD in September 2024 (twelve years eleven months in), VYM in September 2021 (fourteen years ten months in) and VIG in June 2024 (eighteen years two months in). The crossover covered in Dividend Crossover Point: When Passive Income Replaces Your Salary is about the pile and comes early. Takeoff is the launch, and the dividend-only crossing is cruising altitude.
As of the September 25 close, the SCHD model pays about $7,600 a year (about $635 a month), VYM about $9,650 (roughly $800 a month) and VIG about $7,000 (a little under $600 a month). Every one now pays more each month than the $500 still going in. These figures line up with published yields: VIG's 1.5% on its balance is about $7,100 a year, and VYM's 2.3% is about $9,600.
A Corrected 8-4-3 Rule
On value, keep the shape but expect the middle to disappoint. Year eight was on schedule, the doubling took about four and a third to five years rather than four, and the tripling ranged from right on time to nearly two years late. At 8% instead of 12%, think 8-5-3.5. On income, forget the calendar and watch the raise: takeoff came in years 8, 9 and 13, driven by yield and payout growth far more than pile size.
The rule that held in every fund is the one 8-4-3 assumes without saying: the deposit never stopped, including March 2009, the two flat years for SCHD and the five weeks of 2020. Every takeoff was built partly from shares bought in the months that felt worst. The easiest time to give up is the stretch right before takeoff, when income still looks tiny. If you have wondered what happens when investors quit early, The $50K Wall: Why Savers Quit Right Before Compounding Works covers that same psychology.
Watch the Full Video Walkthrough
For the charts, the checkpoint-by-checkpoint comparisons and the timeline of all three funds, watch the full video: I Ran 20 Years of Dividend ETF Data Through the 8-4-3 Rule. Then take your last 12 months of dividends, divide by your monthly contribution, and share that number in the comments along with which year of your plan you are in.
This is education, not financial advice. Every figure comes from a historical model built on published prices and distributions, with no taxes and no missed months. Past performance does not guarantee future results.