- Key Takeaways
- The Jobs Side of a Bust Moves Slower Than Prices
- What $100,000 Did From the March 2000 Top
- What Each Paycheck Did
- The Dividend Aristocrats Index Behind NOBL
- Home Depot: The Check Grew While the Price Fell
- The Job Loss Test: Forced Selling vs a Cash Year
- How Much of the Bills Dividends Actually Covered
- What These Funds Lived Through Since
- How Much AI Is Inside Each Dividend ETF Today
- The 7-Rule Plan for Dividend Investors Facing an AI Bust
- Watch the Full Video Walkthrough
If the next market crash is an AI bust, will dividend paychecks keep coming? To find out, a model replayed the last time tech crashed, from 2000 to 2002, using published prices and distributions one fund at a time. The short answer is that the checks from mature, cash-rich companies mostly kept coming. But a bust hits a household, not just a portfolio, and the job side of the replay produced a far less comfortable answer.
This is a hypothetical model, not a real account, and different start dates give different results. It is a comparison with the dot-com bust, not a forecast. Nobody knows if or when an AI bust comes, and dividends can be cut.
Key Takeaways
- $100,000 in the Dow fund (DIA) on March 24, 2000 paid a bigger check every year of the crash while the shares lost about a third. The same money in QQQ paid nothing for three years and fell about 83%.
- The back-filled S&P 500 Dividend Aristocrats index, which is the index behind NOBL, finished 2000-2002 about 10% higher while the S&P 500 lost about 38%. That is index history, not a fund anyone owned.
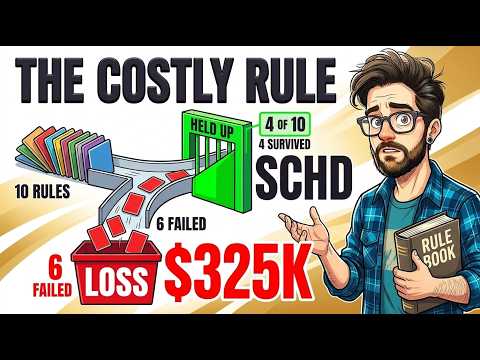
- A household that sold shares to cover a job loss lost almost nothing in one replay and about $82,000 by today in another. The only difference was timing.
- In the last bust, dividends covered roughly one month of a lost paycheck, so a dividend fund is a cushion rather than a salary replacement.
- NOBL and SCHD hold very little of the AI trade, while about a quarter of VIG is technology.
The Jobs Side of a Bust Moves Slower Than Prices
The National Bureau of Economic Research dated the last recession from March 2001 to November 2001, about eight months. Yet the committee only announced the recession had ended in July 2003, and the unemployment rate reached 6.4% in June 2003, according to the Bureau of Labor Statistics. Stocks started falling in 2000, but jobs kept getting worse for almost two years after the market's worst fall began. In 2003 the median person out of work had been looking for about 10.1 weeks.
Today looks different but not entirely safe. The report released October 2, 2026 put September unemployment at 4.2%, with a median unemployment spell of 11.5 weeks, already longer than the 2003 average. Job openings in August were about 7,079,000, roughly one opening per unemployed person, according to KPMG. Challenger, Gray and Christmas tracked 573,195 announced job cuts through September, down about 39% from a year earlier, but the tech sector led with 165,925, and by July AI had been the most cited reason for cuts for five months in a row. In its October 14 Beige Book, the Federal Reserve said firms in five districts had reduced staffing through attrition, delayed hiring or expected to create fewer jobs because of AI productivity gains.
What $100,000 Did From the March 2000 Top
The model started on March 24, 2000, the worst possible day, and spent every payment as it arrived rather than reinvesting. It measured results at the October 9, 2002 bottom of the S&P 500.
- QQQ: about $17,000, a loss of about 83%. It did not close above its March 24 price until August 15, 2016, sixteen years and five months later.
- SPY: about $50,900, back above its start on June 1, 2007.
- DIA: about $65,800, a loss of about a third, back above its start on February 16, 2006.
- XLP: about $97,800, with a lowest close of about $86,600 in March 2003 and a recovery by June 16, 2003. Staples had already fallen before March 2000, so part of that resilience was a cheap starting point.
The further a fund was from the hot trade, the smaller the hole. The hottest fund lost about 83% and needed more than sixteen years. The most boring one was back in about three.
What Each Paycheck Did
QQQ paid zero dollars in 2000, 2001 and 2002, and its first payment in 2003 was about $12 for the year. SPY paid about $927 in 2001, about $975 in 2002 and about $1,061 in 2003, and its payout per share fell about 5% from 2000 to 2001.
DIA is where it gets interesting. It paid about $1,405 in 2001, $1,567 in 2002 and $1,733 in 2003. Its payout per share rose about 4% in 2001, about 11.5% in 2002 and about 11% in 2003. In the years its price fell hardest, its check grew by double digits. XLP paid about $1,555 in 2001 and $1,866 in 2002, then slipped to about $1,745 in 2003 as its payout per share dipped about 6.5%.
From 2000 through 2007, QQQ paid about $683 in total, SPY about $9,884, DIA about $14,492 and XLP about $15,561. Today the order flips on total value: QQQ is worth about $605,000, SPY about $498,000, DIA about $471,000 and XLP about $427,000. The fund that paid nothing and fell the most is worth the most now. That is not a reason to avoid growth, but a reminder that QQQ's job was never the paycheck. The checks that did arrive were small, about 1.5% a year, so they paid bills, not a salary.
The Dividend Aristocrats Index Behind NOBL
NOBL launched in October 2013 and its index in May 2005, so the dot-com numbers are back-filled by S&P using the index rules. According to a table published by the Dividend Growth Investor blog, the Aristocrats index returned about 10.1% in 2000 versus about -9.1% for the S&P 500, about 10.8% in 2001 versus about -11.9%, and about -9.9% in 2002 versus about -22.1%. With dividends reinvested, $100,000 in the Aristocrats at the start of 2000 would have been about $109,900 at the end of 2002, against about $62,400 for the S&P 500. These are calendar years with reinvested dividends, so they are not the same math as the March 2000 paycheck model.
The index worked because a company needs 25 straight years of dividend increases to qualify, and almost no internet darlings paid dividends at all. The rule also cuts both ways: companies that stop raising are removed. International Flavors and Fragrances cut its dividend by about 60% in 2000 and was removed in 2001. American Home Products was removed in 2001 after two years without a raise, and Kellogg was removed in 2003 after about two and a half years of an unchanged dividend. In 2001 the index had about 64 members. It does not promise every company keeps raising, only that the ones that stop get replaced.
Home Depot: The Check Grew While the Price Fell
Home Depot closed at about $68.75 on December 31, 1999 and bottomed at about $20.53 on January 28, 2003, a drop of about 70%. It fell again to about $18 on March 6, 2009 and did not close above its 1999 high until March 1, 2013, thirteen years and two months later. Meanwhile its split-adjusted dividend went from about 11 cents in 1999 to 16 cents in 2000, 17 cents in 2001, 21 cents in 2002, 26 cents in 2003 and 90 cents by 2007, about eight times higher. On $10,000 bought at the top, the yearly check went from about $23 in 2000 to about $131 in 2007. A rising dividend does not protect the price, which is why the paycheck belongs in a fund rather than one stock. Home Depot is about 3.87% of SCHD (per Barron's in early October) and about 1.92% of DGRO (September 30 factsheet).
The Job Loss Test: Forced Selling vs a Cash Year
The model used a household with $236,000 invested that needs $3,000 a month for twelve months after losing a job. Household one holds all $236,000 in SPY and sells shares to cover what dividends do not. Household two holds $200,000 in SPY and $36,000 in cash, spends the cash and dividends, never sells a share, and returns leftover cash to the fund. Interest on the cash was ignored, which would only help household two.
- Job loss in October 2001: at the October 2002 bottom the two households were about $62 apart ($152,284 versus $152,346), and within about $1,000 of each other today at roughly $2.3 million.
- Job loss in April 2001: the household that sold shares came out about $500 ahead at the bottom.
- Job loss in April 2002: household one sold about $33,800 of SPY, mostly into the steepest part of the drop. At the bottom it was worth about $145,200 versus about $152,600 for the cash household, a gap of about $7,400. By the October 2007 high the gap was about $11,900, and today it is about $82,000 ($2,003,000 versus $2,085,000).
- Job loss in July 2002: the gap today was about $28,000.
Selling shares to cover a job loss cost almost nothing in one year and about $82,000 by today in another. The only difference was timing nobody can see coming.
That is why a cash year is insurance, not a strategy. It is bought because the timing is unknown.
How Much of the Bills Dividends Actually Covered
In the April 2002 version, SPY dividends covered about $2,200 of the $36,000 needed, less than one month of twelve. In DIA, dividends covered about $3,500, about one month. At today's higher yields, SCHD's 30-day SEC yield was about 3.12% as of October 22, so roughly $7,000 a year on $236,000, a little over two months of $3,000 bills. Average regular state unemployment benefits were about $496.30 a week over the twelve months ending September 30, 2026, per the Department of Labor, or about $2,150 a month before tax. A dividend fund helps, but the cash year fills the rest.
What These Funds Lived Through Since
VIG's price fell about 48% from the October 2007 high to the March 2009 low, versus about 56.5% for SPY. VIG's payout per share fell about 4.5% in 2009, while SPY's fell about 20%. In 2020, from the winter high to the March 23 low, NOBL fell about 35.5%, SCHD about 33.5% and DGRO about 35%, yet NOBL, SCHD, VIG and DGRO all paid more per share than in 2019, with SCHD's payout up about 17.5%. In 2022, prices fell between about 19% and 21.5%; SCHD's payout rose about 14%, VIG's about 12% and DGRO's about 9%. NOBL's calendar-year payout per share dipped about 6% in 2022 and in a few other years such as 2017 and 2019, because the basket is rebalanced every quarter, though its payout per share has grown about 8.4% a year over the last ten years. For more on NOBL's role, see this 3-bucket dividend strategy with DIVO, NOBL and SCHD.
How Much AI Is Inside Each Dividend ETF Today
- NOBL: equal weighted at about 1.5% per company, 71 positions following an index of 69 members as of September 30. Information technology was about 2.53% of the index as of March 31, with consumer staples about 23.66%, industrials about 21% and financials about 12%. None of Nvidia, Microsoft, Apple, Broadcom, Alphabet, Meta, Amazon or Oracle is in the top holdings. It costs 0.35% and yields about 2%.
- SCHD: technology about 16%, none of those eight names in its top holdings (it owns Texas Instruments, Accenture and Qualcomm). It costs 0.06% with a 30-day yield of about 3.12%.
- DGRO: information technology about 17.32% as of October 22, with Microsoft about 3.22%, Apple about 3.16% and Broadcom about 2.78%, roughly 9% in three AI-linked giants. It holds 391 companies, costs 0.08% and yields about 2.07%.
- VIG: information technology about 25.6% as of August 31, with Microsoft about 4.69%, Apple about 4.52% and Broadcom about 4.36%, about 13.5% in those three. It holds 333 companies, costs 0.04% and yields about 1.51%.
There is one key difference from 2000: the tech companies inside VIG and DGRO pay and raise dividends, while the dot-com bust hit companies that paid nothing. A price drop in a dividend-paying AI giant is not the same thing as a paycheck cut. On the macro view, Adam Posen of the Peterson Institute said on October 20 that a correction in the biggest AI spenders could look more like 1987 or 2000, "where the profits just rotate to adjacent industries and the real economy isn't affected much." Pan Gongsheng of the People's Bank of China said on October 19 that AI has yet to significantly affect overall employment but has begun to change the structure of jobs. Both are quoted, not endorsed.
The 7-Rule Plan for Dividend Investors Facing an AI Bust
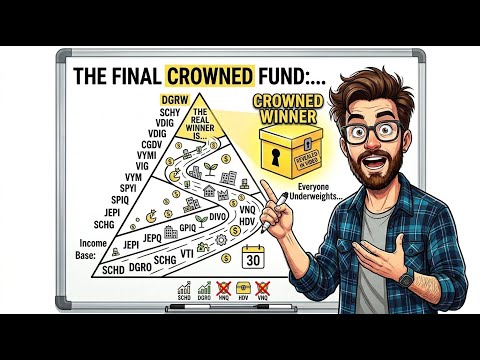
- Keep one year of spending in cash before counting on any dividend fund for crash protection, especially if your job could be hit by an AI bust.
- Keep SCHD as the foundation: its paycheck rose in every crash it lived through and it holds none of the biggest AI names in its top holdings.
- Give NOBL the crash-test seat, remembering it is stability over yield, costs 0.35% and its own check dips in some years.
- If you own VIG or DGRO, know your overlap, and add it up if you also hold an S&P 500 or Nasdaq fund. The DGRO vs SCHD comparison covers how those two differ.
- Keep growth next to income, such as SCHG alongside SCHD, but do not ask a growth fund to pay your bills in a bust.
- Never let one company be the plan, as Home Depot's thirteen-year recovery shows.
- In a bust, judge funds by payout per share year over year, not by price. DIA's price fell about a third while its check grew by double digits.
Watch the Full Video Walkthrough
For the charts, the ten checks in order and the household replays on screen, watch the full video, The 1 Dividend ETF That Passed 5 Market Crashes vs an AI Bust. For the crash test that started it all, see I Tested 14 Dividend ETFs Against 5 Market Crashes - Only 1 Passes. Would you keep a cash year next to your dividend funds, or stay fully invested? Tell us in the comments.
I'm not a financial advisor and this isn't financial advice. Results are hypothetical models from the dates picked; different dates give different results. NOBL did not exist in 2000-2002, so those years use the back-filled history of the S&P 500 Dividend Aristocrats index (published in a secondary table), which is not a fund return. Dividends can be cut. Past performance does not guarantee future results.