- Key Takeaways
- What SCHD Is, and What It Isn't
- The Five Rules for Filling the Seats
- Seat One: The Growth Seat (SCHG vs QQQ vs VUG)
- Seat Two: The World Seat (VXUS vs VYMI vs SCHY)
- The Finished 3-Fund Portfolio: Results
- Year by Year: Which Seat Rescued Which Year
- How to Rebalance Once a Year
- Watch the Video Walkthrough
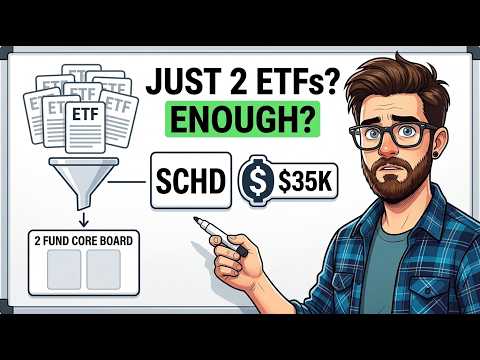
If SCHD is already the core of your portfolio, the next question is obvious: what should sit next to it? SCHD does one job extremely well, delivering steady and growing dividends from quality companies, but by design it leaves two big gaps. It owns almost none of America's biggest growth companies, and it owns nothing outside the United States. After testing six candidates for two extra seats, the best SCHD 3-fund portfolio I found is 50% SCHD, 25% SCHG and 25% VYMI, rebalanced once a year.
This article walks through the rules used to choose, how each candidate scored, and what the finished mix did in good and bad years. Everything below is a model built on published prices and dividends, not a real account.
Key Takeaways
- SCHD is the foundation, but it has two built-in gaps: the giants of U.S. growth and every company outside America.
- Seat one (growth) goes to SCHG; the runner-up is QQQM, the best performer but more costly and more concentrated.
- Seat two (world) goes to VYMI, which had the best record of the three international candidates and yields about 3.7%.
- Since March 2016, $100,000 in a 50/25/25 mix grew to about $404,000 versus about $363,000 in SCHD alone, and fell about 11% in 2022 versus about 18% for the S&P 500.
- The blended cost of the three funds is about 0.06% a year, or roughly $57.50 on $100,000.
- Past performance does not guarantee future results, and back tests depend on start dates.
What SCHD Is, and What It Isn't
SCHD tracks the Dow Jones U.S. Dividend 100 index. A company must have paid a dividend for at least ten years in a row to qualify. The index then ranks the survivors on cash flow compared with debt, return on equity, dividend yield and five-year dividend growth, and keeps the best hundred. Real estate trusts and pipeline partnerships are excluded.
The result is a quality screen with a yield tilt. As of mid October, the top ten holdings included Texas Instruments, Procter and Gamble, Qualcomm, Coca-Cola, Chevron, ConocoPhillips, UnitedHealth, Amgen, Home Depot and Merck. By sector, Schwab's latest breakdown shows about 21% health care, about 20% consumer staples, about 14% energy, about 12% industrials, about 10% financials and only about 9% technology.
The index is rebuilt every March, so the SCHD you own in twenty years will not hold the same hundred companies it holds today. It costs 0.06% a year, yields about 3.1%, and its payout per share has grown about 10.5% a year over the last ten years.
Here is what is missing:
- The giants of growth. Amazon and Tesla pay no dividends. Alphabet and Meta only started paying in 2024, so they are years away from the ten-year rule. Apple, Microsoft and Nvidia pay small dividends relative to their prices and rank low on yield.
- The rest of the world. SCHD owns only U.S. companies, so Nestle, Toyota and the big European banks and drug makers are out of reach.
- A sector tilt. Energy, staples and health care are a large share, while technology is small.
The tilt cuts both ways. In 2022, when rising rates crushed growth stocks, SCHD lost only about 3% with dividends reinvested while Schwab's growth fund lost about 32%. Through September of this year, SCHD has returned more than 21% by Schwab's figures. But over fourteen years, $100,000 in SCHD grew to about $627,000, while Schwab's growth fund grew to about $1.1 million.
The Five Rules for Filling the Seats
Each candidate was judged on the same five rules:
- Each seat gets one job, and only one.
- The fund must own what SCHD doesn't, measured by correlation (1 means lockstep, lower means more independent).
- Cost, because every hundredth of a percent compounds over twenty years.
- Breadth, so one fund doesn't hang on a handful of stocks.
- Behavior in SCHD's good years and bad years.
Back tests start at the end of 2011, SCHD's first full year, wherever the candidate is old enough. Dividends are reinvested and mixed portfolios are rebalanced once a year.
Why VYM, DGRO and VIG Don't Qualify as Second Seats
They are good funds, but too similar to SCHD. Since 2012, VYM's month-to-month correlation with SCHD was about 0.96, DGRO's (since 2014) about 0.95 and VIG's about 0.9. Growth candidates sit around 0.6 to 0.66 and international candidates around 0.76 to 0.79. Adding VYM is doubling down, not diversifying. For more on how closely these dividend funds overlap, see DGRO vs SCHD: The Dividend Growth Stall Investors Need to See.
Why Not Just VOO?
VOO is a fine choice: $100,000 became about $796,000 since the end of 2011, about 15% a year. But its correlation with SCHD was about 0.84, because it already owns most of what SCHD holds. A dedicated growth fund fills the gap more directly.
Seat One: The Growth Seat (SCHG vs QQQ vs VUG)
Since the end of 2011, here is how $100,000 grew in each candidate:
- QQQ: about $1.463 million (almost 20% a year), correlation with SCHD about 0.62, fee 0.18% (QQQM 0.15%), fell about 33% in 2022, worst drop about 35%, yield about 0.4%.
- SCHG: about $1.098 million (about 17.5% a year), correlation about 0.66, fee 0.04%, fell about 32% in 2022, yield about 0.4%. Its top ten holdings make up about 61% of the fund.
- VUG: about $996,000 (about 16.8% a year), correlation about 0.66, fee 0.03%, fell about 33% in 2022.
All three crushed SCHD's $627,000 over this stretch, and all three fell about a third in 2022 while SCHD barely moved.
On the last fourteen years alone, QQQ wins. But for the next twenty, three things matter more: cost, breadth and partnership. SCHG charges 0.04% against QQQM's 0.15%, a gap worth thousands of dollars on a $100,000 seat. QQQ includes only Nasdaq-listed companies, so it leaves out names like Eli Lilly, which trades on the NYSE. And SCHG and SCHD share a family and both follow Dow Jones indexes, covering the growth half and the dividend half of large-company America with very little overlap.
Seat one goes to SCHG. If you prefer QQQM, you accept more concentration and cost for the strongest performer, a reasonable trade, just not the one I'd make for twenty years. We covered the two-fund version in SCHD and SCHG: The 70/30 Core Satellite Strategy Explained.
In practice the two funds steady each other. At 25% of a portfolio anchored by SCHD, the 2022 growth collapse was cut by more than half, and in 2023 the growth seat rose about 50% while SCHD rose less than 5%.
Seat Two: The World Seat (VXUS vs VYMI vs SCHY)
International stocks have lagged badly. Since the end of 2011, VXUS turned $100,000 into about $313,000, about 8% a year, versus about 13% for SCHD and about 15% for the S&P 500. But that is one era, not a law of nature. In the decade from 2000 through 2009, according to one published comparison, the S&P 500 lost about 0.9% a year while international developed stocks gained about 1.2% a year. In 2026 through mid October, Vanguard's international high dividend fund is up almost 16% with dividends, ahead of the S&P 500 at about 13.5%, and one asset manager notes the U.S. dollar fell more than 9% in 2025. Seat two is insurance against the decade where America isn't the winner.
- VXUS: about 8,900 companies, fee 0.05%, yield about 2.4%, correlation with SCHD about 0.76, fell about 16% in 2022.
- VYMI: fee 0.07%, yield about 3.7%, correlation about 0.79, fell only about 7% in 2022. Since March 2016 it grew about 10.5% a year versus about 9.2% for VXUS. Its payout has grown about 11% a year over five years. Its weakness: a roughly 40% drop from January 2018 to the 2020 crash low.
- SCHY: fee 0.08%, yield about 3.6%, launched April 2021. From the end of May 2021 it grew about 8.3% a year versus about 7.5% for VXUS and about 12.2% for VYMI, and fell about 9% in 2022.
SCHY applies SCHD's method abroad, but with about five years of history I'd want a longer record. Seat two goes to VYMI: best record over every window tested, best 2022, and the most income. VXUS would dilute the paycheck at about 2.4%, while VYMI keeps it at about 3.7%, making it the seat an income investor will actually keep through a bad stretch.
The Finished 3-Fund Portfolio: Results
Tested from the end of March 2016 (VYMI's start), with yearly rebalancing:
- SCHD alone: $100,000 became about $363,000, about 13% a year.
- 50% SCHD / 25% SCHG / 25% VYMI: about $404,000, about 14.2% a year, or $41,000 more.
- S&P 500 alone: about $444,000.
- 60/20/20 income tilt: about $397,000, fell about 10% in 2022.
- 40/30/30 growth tilt: about $411,000, fell about 13% in 2022.
The mix's biggest drop was about 34%, almost the same as SCHD's about 33%, and in 2022 it fell about 11% versus SCHD's 3%, the S&P 500's 18% and the growth funds' 30%-plus. Blended cost is about 0.06% a year, about $57.50 on $100,000. Income on today's yields is about $2,555 a year on $100,000, versus about $3,080 for SCHD alone, a gap of about $525 given up for growth and global exposure. On $250,000, the mix pays about $6,400 a year.
Monthly investing worked too: $500 a month since April 2016 (about $64,000 contributed) grew to about $133,000 in SCHD alone, about $146,000 in the mix and about $154,000 in the S&P 500.
One honest caveat: since 2011, holding 75% SCHD and 25% SCHG with no international seat would have reached about $748,000 against about $637,000 with VXUS in seat two. That is the price of insurance in a decade where America won.
Year by Year: Which Seat Rescued Which Year
Calendar returns with dividends reinvested show the low-correlation pattern at work:
- 2018: SCHD down about 6%, SCHG down about 1%, VYMI down about 13%, mix down about 6%.
- 2021: SCHD up almost 30%, mix up about 26%.
- 2022: SCHG down about 32%, VYMI down about 7%, SCHD down about 3%, mix down about 11%. The foundation carried the portfolio.
- 2023: SCHD up less than 5%, SCHG up about 50%, mix up about 19%. The growth seat rescued the year.
- 2025: SCHD up about 4%, VYMI up about 38%, mix up about 16%. The world seat rescued the year.
- 2026 through mid October: SCHD up almost 28%, SCHG about 9.5%, VYMI about 16%, mix about 20%.
The mix never had a calendar year worse than about minus 11%. Rebalancing added to this: after 2022, a mix drifted to about 55% SCHD, 19% SCHG and 26% VYMI, and the annual rule would have topped SCHG back up to 25% just before it rose about 50% in 2023.
How to Rebalance Once a Year
Pick a date you will remember. Check whether any fund has drifted more than five percentage points from its target. If SCHG has run to 35%, trim it to 25% and add to whichever fund fell behind. If you add money monthly, simply send new money to the fund furthest below target.
Know the risks of each seat. SCHG is concentrated, with about 61% in its top ten, and growth leaders could stumble together as they did from 2000 to 2002. VYMI carries currency, sector (banks and energy) and depth risk, as its roughly 40% drop showed. SCHD's tilt can make it feel slow when growth leads. Each fund's worst moments tend to land at different times, which is the point.
If you are retired and living on the checks, lean toward 60/20/20. If you are in your thirties or forties and adding money monthly, 50/25/25 or 40/30/30 gives the seats more room to work. For income-focused portfolios, see also 3-Bucket Dividend Strategy: DIVO, NOBL & SCHD for Retirement.
Watch the Video Walkthrough
For the charts, year-by-year tables and the full side-by-side comparisons, watch the video: If I Could Only Add 2 ETFs to SCHD for the Next 20 Years, I'd Pick These. The next video in the series, I Split $100K Between SCHD and SCHG, tests the two-fund version on real numbers. Would you fill both seats, or just one? Tell us in the comments.
Disclaimer: This is education, not financial advice. Results are models built on published prices and dividends over specific windows, not a real account. Back tests depend on start dates, and past performance does not guarantee future results.