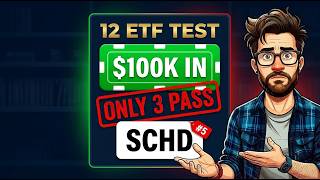
Ten years. One hundred thousand dollars. Twelve dividend ETFs. Same starting capital, same decade, one blunt question at the end: how much cash did you actually pay out, and what was the original investment worth when the clock stopped? The gap between the best and worst combined outcome exceeded $160,000 — on identical starting money. Only three of the twelve funds grew both the income stream and the principal at the same time. The other nine made a trade-off that cost investors who were not watching the right number.
Key Takeaways
- The combined scorecard — cumulative cash paid plus ending portfolio value — reveals what yield alone cannot.
- SPYD paid the most raw income of all twelve funds and still finished near the bottom due to principal erosion.
- SCHD produced a strong result (~$294K combined) but fell short of the top three on total outcome.
- VOO, carrying the lowest yield of the entire group, won with a combined outcome of approximately $353,000.
- High starting yields consistently predicted weaker total outcomes; all three top-tier funds started below 1.5% yield.
- Expense ratios of 0.38%–0.62% cost the middle-tier funds their shot at the top over a compounding decade.
How the Test Was Structured
The methodology is deliberate, and the rules are the whole point. Each of the twelve funds received a hypothetical $100,000 on the same starting date, roughly ten years back. Every distribution came out as cash — not reinvested — to simulate a retiree or income investor who actually spends dividend payments rather than buying more shares. At the end of the window, the current value of the remaining shares was added to the cumulative cash received. That combined figure — income collected plus ending principal — is the only scoreboard used here.
Two structural notes: SPYD launched in late 2015 and DIVO in late 2016, so neither carries a full ten-year record, and those comparisons are directional rather than perfectly calendar-matched. One fund — VOO — is a broad market index fund, not a dividend product. It was included deliberately as a demanding benchmark, and where it finished is one of the more instructive findings of the entire test.
All figures are modeled historical estimates based on each fund's starting yield, distribution growth rate, and price behavior over the window. They illustrate how these strategies have behaved — they are not brokerage statements and make no claim about the next decade.
The Bottom Four: High Yield, Fading Principals
Every fund at the bottom of this ranking paid a generous income stream. Not one earned it on the combined scorecard, because the principal behind the check either stalled or barely moved. A large check on top of a static or shrinking pile is the central trap this test was built to expose.
#12 — SDOG: ALPS Sector Dividend Dogs (~$184K combined)
SDOG selects the five highest-yielding stocks from each major market sector, betting those "dogs" will recover and outperform. The current yield sits near 3.4% and the expense ratio is 0.36%. Over the decade, the income stream delivered roughly $40,000+ in cumulative cash. The underlying portfolio produced the weakest price growth of any fund tested, and distribution growth crept at a minimal pace. Combined outcome: approximately $184,000 — the worst result of the group.
A stock often carries a high yield precisely because the market no longer expects its price to appreciate. SDOG's approach collects that fat check while the businesses behind it stagnate. The income arrived; the principal did not grow. That is the trade-off the bottom of this list repeats.
#11 — SPYD: SPDR S&P 500 High Dividend ETF (~$222K combined)
SPYD selects the 80 highest-yielding names in the S&P 500, equally weighted, with a current yield above 4%. It paid the most raw income of all twelve funds — roughly $47,000+ in cumulative cash over the window. On a pure income basis, it looks like a champion. But income is only half the scorecard.
SPYD's price growth was among the weakest in the group. The distribution plateaued in stretches and took a meaningful cut in 2020 when high-yield names broadly slashed payouts. The ending principal was thin. Combined outcome: approximately $222,000 — more than $130,000 behind first place despite paying nearly double the income of the winning fund. SPYD is the most direct proof that a large check can come at the direct expense of the principal generating it. For a closer look at why dividend growth screens tend to outperform high-yield screens over a full cycle, the DGRO vs SCHD: The Dividend Growth Stall Investors Need to See breakdown covers the same dynamic from a different angle.
#10 — DIVO: Amplify CWP Enhanced Dividend Income (~$236K combined)
DIVO is architecturally different from every other fund here. It holds a focused basket of quality dividend payers and sells covered call options on a portion of them, generating extra income from the premiums. The resulting distribution rate runs near 6% — but a portion of that figure is option income, not company dividends, so it is properly called a distribution rather than a yield. DIVO launched in late 2016, making this a roughly 9.5-year comparison rather than a full decade.
Over that window, DIVO distributed approximately $50,000 in cumulative payments. The structural cost: every covered call caps the upside when a held stock surges, and that gain stays outside the portfolio. The heaviest expense ratio on the list — above 0.50% — added drag on top. Combined outcome: approximately $236,000. For income-first retirees who need maximum current cash flow, DIVO serves a real purpose. On a total-outcome basis, the capped upside kept it well short of the top tier.
#9 — DVY: iShares Select Dividend ETF (~$241K combined)
DVY has operated since 2003, targeting roughly 100 higher-yield dividend payers with established payment histories. The current yield is near 3.3% and the expense ratio is 0.38%. Distribution growth was among the slowest tested. Combined outcome: approximately $241,000. No dramatic collapse drove this result — only a decade of compounding mediocrity, where a fee that steadily skimmed a slow-growing pile left the outcome well behind cheaper and faster-growing alternatives.
The Middle Tier: Good Funds Held Back by One Flaw
Funds ranked sixth through eighth — FVD, FDL, and VYM — are well-constructed products. Each fell short of the top tier for a specific and identifiable reason.
FVD (First Trust Value Line Dividend, ~$248K combined) posted healthier price growth than any of the bottom four, but an expense ratio near 0.62% — the highest of any fund tested — quietly eroded that advantage over ten years. A sound strategy wearing an expensive coat.
FDL (First Trust Morningstar Dividend Leaders, ~$258K combined) paid more raw income than several funds that ranked above it, yet middling price and distribution growth combined with a 0.43% expense ratio left the combined outcome in the middle of the pack. More income, lower rank — the recurring theme of this entire test.
VYM (Vanguard High Dividend Yield, ~$259K combined) holds nearly 600 companies at a minimal expense ratio, and price appreciation was meaningfully better than the high-yield traps below it. The single constraint: distribution growth near just 5% annually — slightly too slow to claim a spot in the top tier.
The Near Misses: SCHD at #5 and DGRO at #4
#5 — SCHD: Schwab US Dividend Equity ETF (~$294K combined)
SCHD is the anchor of the dividend ETF world, and its result reflects that reputation. Roughly 100 stocks screened not just for paying a dividend but for the financial strength to keep raising it. A yield near 3.2%, a fee of 0.06%, and dividend growth near 8% annually. Over the decade, SCHD paid approximately $46,000 in cumulative income — one of the strongest cash streams on the list — while the underlying principal grew to a solid ending value. Combined: approximately $294,000. SCHD did both jobs. It simply did not do them quite as well as the three funds above it, because its price appreciation trailed the quality-growth funds at the top and its distribution, while excellent, grew a touch slower than the fastest raisers.
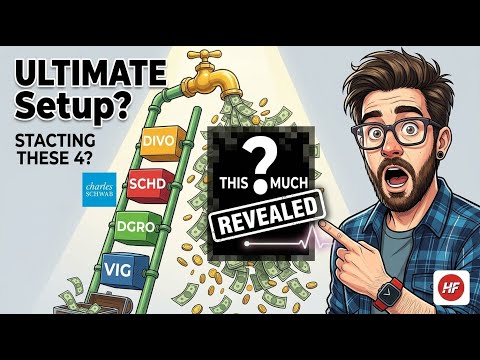
This test deliberately excludes reinvestment to isolate raw income and principal behavior; on a total-return basis with dividends compounded, SCHD's ranking could differ. For investors building a multi-fund income portfolio around SCHD, the 4-ETF Dividend Ladder: How VIG, DGRO, SCHD & DIVO Pay $613/Month shows how these funds can complement each other.
#4 — DGRO: iShares Core Dividend Growth ETF (~$320K combined)
DGRO holds roughly 400 companies with consistent dividend-growth records at an expense ratio of 0.08%. The starting yield is near 2%, modest compared to the funds below it, but the distribution grew at one of the faster rates tested. The ending principal value pushed toward $290,000 on its own. Combined: approximately $320,000. DGRO crossed the threshold into top-tier performance on the combined number, yet fell short of the final three by the narrowest margin in the entire ranking. The difference between fourth and third was not yield and not fees — it was one additional notch of compounding on the principal.
The Three That Earned It
All three top-tier funds share the same defining trait: a growing income stream sitting on top of a principal that compounded at a strong pace. None of them offered the largest starting yield. All three delivered the largest combined outcomes. The income and the principal moved together — which is precisely what the funds below them failed to accomplish.
#3 — VIG: Vanguard Dividend Appreciation ETF (~$334K combined)
VIG's entry requirement is straightforward: a company must have raised its dividend for at least 10 consecutive years to qualify for inclusion. That single filter eliminates fragile payers and retains only businesses with the durability to grow distributions through rough markets. The starting yield is approximately 1.5% — the lowest among the dedicated dividend funds tested.
VIG paid less income than SDOG over the decade yet finished approximately $150,000 higher in combined outcome on the same starting capital. The smaller check that grew consistently, sitting on a compounding pile, outperformed the larger check on stagnant principal by a margin that defines the entire premise of dividend growth investing.
Cumulative cash over the decade reached nearly $30,000 — less than SDOG or SPYD paid. But the portfolio compounded the original $100,000 into an ending value comfortably above $300,000. Combined outcome: approximately $334,000. VIG earned its finish by doing the harder, quieter thing: growing the check and the pile simultaneously, powered by businesses that had proven they could raise their dividends through multiple market cycles.
#2 — DGRW: WisdomTree US Quality Dividend Growth ETF (~$341K combined)
DGRW applies a quality screen that goes beyond dividend history — it weights toward the most profitable companies with the strongest track records of paying and growing dividends. The starting yield is near 1.3% and the expense ratio runs approximately 0.28%. The distribution grew at one of the fastest rates on the entire list, so the small starting check became meaningfully larger by year ten, delivering roughly $30,000 in cumulative income. The underlying portfolio compounded the $100,000 into an ending value above $310,000. Combined: approximately $341,000.
DGRW illustrates the central argument of this comparison in one fund. The check started small, grew while the pile grew, and investors who held it for a decade received both meaningful income and meaningful principal growth without being forced to trade one for the other.
#1 — VOO: Vanguard S&P 500 ETF (~$353K combined)
VOO is not a dividend fund. Its yield barely clears 1%. Its expense ratio is 0.03%. Nobody markets it as an income vehicle. It won this test by the widest margin of any fund on the list.
Over the decade, VOO paid approximately $26,000 in cumulative income — the least of all twelve. On a pure income basis, it finished last. But the ending value of the original $100,000, driven by the price appreciation of 500 of the largest American businesses at a fee that barely registers, pushed toward $327,000. Combined: approximately $353,000. VOO out-earned SPYD — the largest income payer — by more than $130,000 in combined outcome despite paying roughly half the cash.
The explanation is arithmetically unavoidable: when principal growth is strong enough, it can outrun a generous dividend stream because the principal is the larger half of the total score. Over this particular decade, broad U.S. equities appreciated at a rate no dividend-focused screen matched. That result is historically specific, not a universal law. A market environment that punished broad equities and rewarded high-yield strategies would reorder this list substantially. What VOO actually proves is narrower and more important: measuring income without also measuring the principal behind it tells only half the story — and half the story is exactly how investors end up choosing the wrong fund.
The One Pattern Running Through All Twelve
Line the outcomes up from worst to best and one thread becomes unmistakable. The four lowest-ranked funds all carried starting yields above 3%. The three highest-ranked funds all started with yields below 1.5%. The entire ranking inverts the day-one yield table. Every fund that paid the most up front finished lowest. Every fund that paid the least up front finished highest.
The winner's common trait: a growing check sitting on a principal that compounded at a meaningful rate. The loser's common trait: a generous initial check on a pile that went nowhere. The scorecard that reveals this — cumulative income plus ending principal value — is the one almost no fund marketing material shows. It is also the only one that reflects what actually happened to the money.
Watch the Full Ranked Breakdown
The complete video covers all twelve funds in ranked order from worst to best, including the specific distribution growth rates, price appreciation curves, and year-by-year cash figures that produced each combined outcome. The visual presentation of the ranking building fund by fund makes the pattern significantly more tangible than the article alone can capture.
Watch on YouTube: I Put $100,000 Into 12 Dividend ETFs — Only 3 EARNED It
All figures are historical, modeled estimates based on each fund's starting yield, distribution growth, and price behavior over the measurement window. This article is for educational purposes only and does not constitute financial advice. Past performance does not guarantee future results. Consult a qualified financial professional before making investment decisions involving real capital.