- Key Takeaways
- What the Model Actually Measures
- The First Four Years: When Saving Does Almost All the Work
- April 2017: The Month the Market Took Over
- The Crossover Isn't Permanent
- How Reliable Is This Number?
- What Happens If You Stop Contributing at the Crossover
- The Second, Quieter Crossover
- Watch the Full Breakdown
- What This Means for Your Own Portfolio
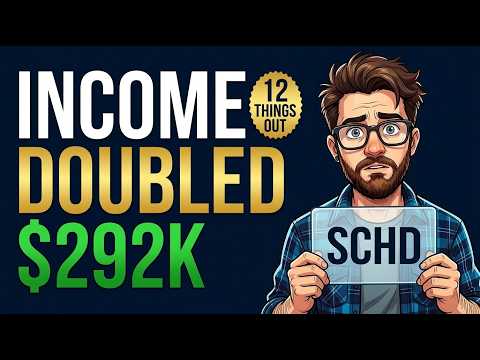
Most explanations of the dividend crossover point describe it as a finish line: the day your portfolio starts earning more than you save, after which saving stops mattering. A 14-year model built from the actual published annual returns of SCHD and VOO tells a messier and more useful story. The crossover happened in April 2017, at a balance of roughly $67,100. Nine months later it reversed. It reversed again four years after that. And the contribution required to reach a $350,000 ending balance was less than half of what a reasonable guess would suggest.
Key Takeaways
- The model used a fixed $735 monthly contribution, 70% SCHD and 30% VOO, starting January 2012, with every distribution reinvested.
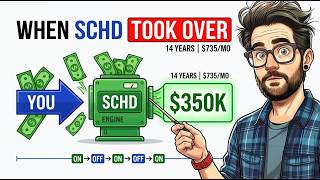
- The crossover — the point where annual market growth exceeds the annual contribution — arrived in April 2017, five years and four months in, at a balance of about $67,100.
- It reversed twice: growth was -$4,580 in 2018 and -$16,576 in 2022. The 2020 crash, despite being faster and scarier, did not reverse it because the market recovered within the same calendar year.
- Shifting the assumed annual return by plus or minus 2 percentage points barely moved the crossover year, but it swung the 14-year ending balance by roughly $119,000.
- There is no peer-reviewed research on the dividend crossover point. Independent blogs and calculators using conservative blended returns put the timeline closer to 13 years, not five.
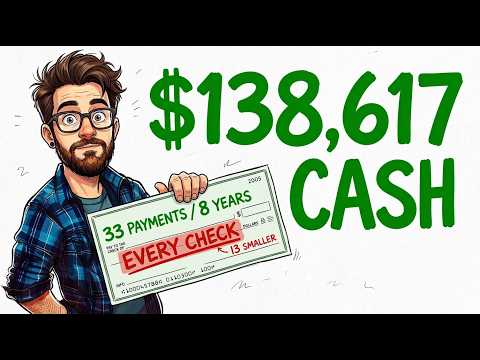
- Stopping contributions right at the crossover point projects to about $435,600 by 2032. Continuing the same $735/month projects to about $826,100 — nearly double.
What the Model Actually Measures
This is not a real brokerage account. It is a model built from the published annual total returns of two funds, applied to a fixed monthly contribution and a fixed 70/30 allocation, with growth and contributions tracked separately for each year so the two can be compared directly. The 70/30 core-satellite structure is a common way investors pair SCHD's dividend yield with broader market exposure through VOO, though this particular case study uses VOO rather than SCHG as the growth sleeve.
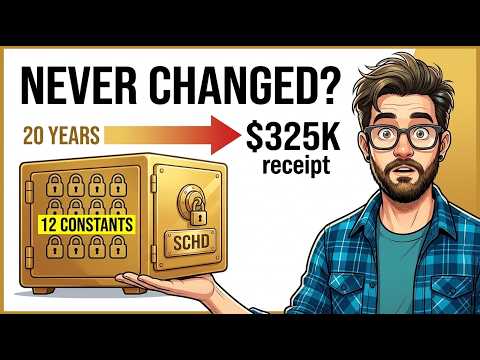
The first surprising finding arrived before any year-by-year analysis. A reasonable assumption for someone building toward a mid-six-figure dividend portfolio over 14 years might be $1,500 a month. Run that contribution through this exact allocation and period, and the ending balance is not $350,000 — it's roughly $714,000, more than double. The contribution that actually lands near $350,000 is $735 a month, less than half the intuitive guess. Compounding over 14 years is strong enough that even a reasonable estimate of what it takes was off by a factor of two.
The First Four Years: When Saving Does Almost All the Work
In 2012, the first full year, contributions totaled $8,820 and growth was $599 — about 94% of the year-end balance of $9,419 was money that came directly from a bank account. In 2013, an exceptional year when both funds returned over 30%, growth reached $4,580 against the same $8,820 contributed — still short of half.
The year that tests most savers' patience is 2015. Contributions were $8,820, as always. Growth for the entire year was $75. One fund returned slightly below zero; the other barely above 1%. On a balance of around $35,000, that is the arithmetic of a strategy that is working exactly as designed and still feels like it is going nowhere. This is the stretch where most savers quit — not dramatically, usually just by skipping a few months or reducing the contribution, right before the balance gets large enough for percentage returns to start mattering.
Across the first four years combined (2012–2015), the saver contributed $35,280. The market contributed $8,623 — roughly a four-to-one ratio in favor of the contribution. For four years, the portfolio was functionally a savings account with volatility attached.
April 2017: The Month the Market Took Over
The shift was not gradual. In 2016, growth reached $7,351 against an $8,820 contribution — close, but not over the line. In 2017, growth hit $13,661, about 55% more than the $8,820 contributed. Measured on a rolling 12-month basis rather than by calendar year, the actual crossing happened in April 2017, at a balance of approximately $67,100 — five years and four months after the first contribution.
That balance is lower than most people assume is required. The crossover is triggered by accumulated balance, not by exceptional returns — which means its arrival is far more predictable than the market itself.
The crossover is caused by accumulated balance, not by better returns — which makes its timing far more predictable than the market.
The Crossover Isn't Permanent
Nine months after crossing over, the portfolio un-crossed. In 2018, both funds finished the year down, and growth came in at -$4,580 on a balance that had grown past $80,000. The contribution was once again the only source of value added, and it was simultaneously offsetting a loss.
The far larger reversal came in 2022: growth of -$16,576 on a balance over $200,000 — nearly twice what the saver contributed that year, lost. Notably, 2020 did not reverse the crossover despite the fastest market decline in modern history happening that March. Growth for the full calendar year 2020 was still a positive $20,314, because the decline and recovery happened within the same 12 months. An annual measurement simply doesn't register a crash that repairs itself before December. The lesson: it isn't how frightening a year feels that determines whether the crossover holds, but whether the year finishes up or down by the time it's measured.
Full Reversal Record
On, in 2017. Off, in 2018. Back on. Off again in 2022. On since. Four state changes across 14 years, each one determined by whether a single calendar year closed positive or negative.
How Reliable Is This Number?
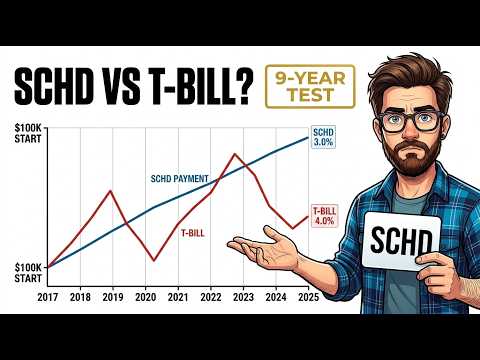
A search for academic literature on the dividend crossover point turns up nothing — not thin coverage, none. The concept exists almost entirely in personal finance blogs, retirement calculators, and financial-independence community content. One Canadian financial planning blog calculates roughly 13 years to crossover assuming a 5.5% return, and about 23 years at 3%. A separate calculator lands around 12–14 years assuming a 7% return.
Those estimates differ sharply from this model's 5-year-4-month result because they assume a conservative blended return, while this model ran the actual returns of two equity funds across one of the strongest 14-year stretches in market history. Neither is wrong — they're answering the same question in different markets. A fair summary is that the crossover can take anywhere from roughly five to 23 years depending on actual returns, which is reason enough to build a plan around the contribution rather than the crossing date.
A sensitivity test on this model reinforces that point. Shifting every annual return down 2 percentage points still produced a 2017 crossover; shifting it up 2 points also produced a 2017 crossover. The year barely moved. The ending balance did: $296,000 in the harsher scenario, $350,000 in the base case, and $415,000 in the kinder one — a swing of roughly $119,000 from a 4-point difference in assumed returns. The timing of the crossover is fairly stable. The dollar amount you end up with is not.
What Happens If You Stop Contributing at the Crossover
This is the single most consequential number in the entire model. Taking the balance at the crossover point — $67,095 in April 2017 — and projecting it forward to 2032 at the blended rate these two funds actually delivered: a saver who stops contributing entirely at the crossover ends up with about $435,600, throwing off roughly $13,500 a year in dividends. A saver who changes nothing and keeps contributing $735 a month ends up with about $826,100, throwing off roughly $25,600 a year — nearly double the balance and nearly double the income, from a decision that, in the moment, looked like it barely mattered because the market was already out-earning the contribution four to one.
The reasoning behind this gap comes down to sequence risk. A crossover calculated on average returns ignores the possibility that the next several years look like 2018 and 2022 rather than 2019 and 2021. In both actual reversal years in this record, the contribution was the only positive force in the portfolio. Reaching the crossover makes further saving optional in the sense that the plan no longer depends on it — it does not make continuing to save unproductive, and for more on how this broader concept plays out over a full retirement timeline, see this breakdown of the dividend crossover point and when passive income replaces a salary.
The Second, Quieter Crossover
There's a second milestone hiding inside the first one, and it's arguably more meaningful because it doesn't flicker on and off with the market. At today's blended yield across SCHD and VOO, the final 14-year balance produces roughly $8,600 a year in dividends alone — against an $8,820 annual contribution. Those two numbers are now essentially level.
Unlike total growth, which includes price appreciation and went negative twice in this record, dividend income rose in every single year, including 2018 and 2022. That makes the income crossing a more durable signal than the price-based one, even though it arrives later and gets far less attention.
Watch the Full Breakdown
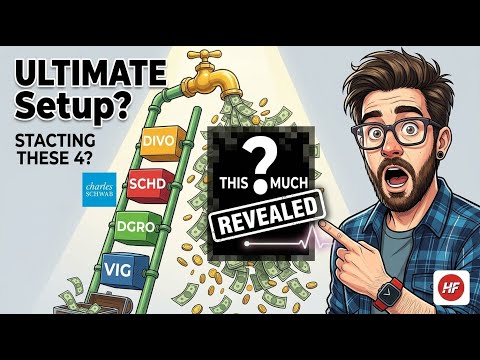
The numbers above cover the headline checkpoints, but the full video walks through all 14 years side by side, including the month-by-month crossing point, the sensitivity tests run against both return assumptions and start dates, and the exact table this model is built from. For anyone tracking their own progress toward a crossover point, watching the year-by-year visual makes the shape of the curve — flat, then jagged, then decisively tilted — much easier to see than the numbers alone.
What This Means for Your Own Portfolio
The first four years of a compounding plan are the ones that feel the most pointless and matter the most. The crossover arrives at a balance, not on a date, which means the contribution amount controls the timing far more than market timing does. And it is not permanent — it reversed twice in 14 years, and both reversals landed on a larger balance than the original crossing did. Anyone presenting the crossover as a finish line hasn't modeled a down year.