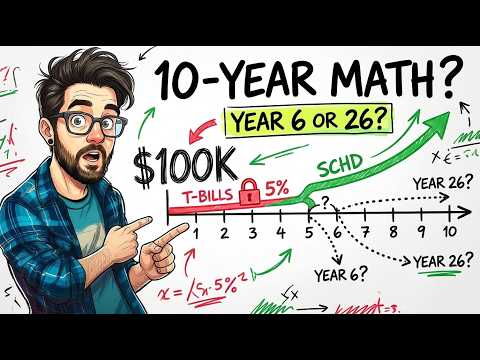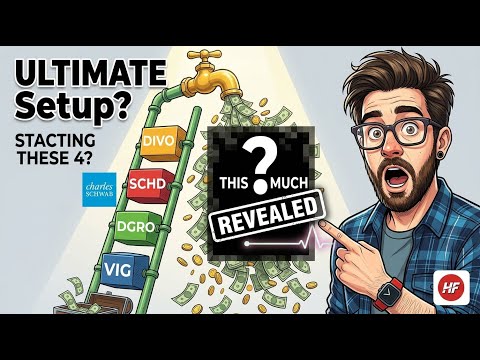
How long does it take to turn $100,000 into $1 million in dividend ETFs? The popular answer is the Rule of 72. To test it, this analysis used almost 20 years of real prices and dividends. A $100,000 deposit was placed on December 29, 2006, in VIG, VYM and DVY (SCHD joins from October 2011, DGRO from June 2014), with the S&P 500 (SPY) as the yardstick and every dividend reinvested. The Rule of 72 proved right on average but wrong on timing.
This is education, not financial advice. Every figure comes from a model built on published prices and dividends, not from a real account. Past performance does not guarantee future results.
Key Takeaways
- No fund reached $1 million from a single $100,000 deposit in about 20 years: VIG reached about $666,000, VYM about $564,000, DVY about $456,000 and the S&P 500 about $777,000.
- SCHD reached about $647,000 in just 15 years, about 13.3% a year, the fastest growth in the test.
- Adding $500 a month took VIG past $1 million in 18 years and 11 months; $1,000 a month took it there in 17 years.
- Doublings are lumpy: VIG's first took about 10 years (the 2008-2009 crash), its second only 4.5.
- Reinvested dividends supplied about 38% of VIG's growth, 55% of VYM's and 66% of DVY's.
- Start date matters: $100,000 in VIG at the March 9, 2009 bottom is worth about $1.13 million today.
The Test Setup
The start date is December 29, 2006, the last trading day of that year. Each fund receives $100,000, and every dividend is reinvested on the day it is paid at that day's closing price. There are no fees beyond each fund's own costs, no taxes (as if held in an IRA) and no new money unless stated.
Three dividend funds have a full 20 years of history. VIG is Vanguard's Dividend Appreciation fund, which holds companies with at least ten years of dividend raises. VYM is Vanguard's High Dividend Yield fund, with hundreds of above-average payers. DVY is iShares' Select Dividend fund, which leans toward the highest yielders. The S&P 500 comes through SPY. SCHD (Schwab U.S. Dividend Equity) joins from the end of October 2011 and DGRO (iShares Core Dividend Growth) from the end of June 2014.
The start was unkind: ten months later the financial crisis began, so the test opens with the worst crash in 80 years. A $100,000 lump sum is realistic, whether from an old 401(k) rollover, an inheritance or a home sale.
The Rule of 72 and the Path to $1 Million
The Rule of 72 says to divide 72 by your yearly return to get the years needed to double your money. At 6%, about 12 years; at 8%, about 9; at 10%, about 7.2; at 12%, about 6. The exact math at 8% gives 9.01 years. Investopedia says the rule is most reliable between roughly 5% and 10%.
Going from $100,000 to $1 million means growing ten times, or about three and a third doublings. At 7% a year that takes about 34 years, at 10% about 24 years, and at 12% about 20 years. The S&P 500 has returned roughly 10.5% a year with dividends reinvested since 1957, according to NYU's Aswath Damodaran as cited in recent market coverage. That is a doubling about every seven years, or about 23 years to $1 million.
Going from 7% to 10% doesn't shave off a little time. It shaves off about ten years.
The rule assumes the same return every year. Real markets deliver a loss of 45%, then a gain of 25%, then 12%. The average can match while the doublings arrive in lumps: sometimes ten years, sometimes four.
The Doublings, Fund by Fund
DVY: The High Yielder
DVY holds about 100 of the highest-yielding U.S. dividend stocks, weighted by dividends, and charges 0.38% a year, the highest in the group. From May 2007 to March 9, 2009, the account fell about 63%, to roughly $40,000, and did not regain $100,000 until July 2012. The first doubling came in November 2017, almost 11 years in, and the second in November 2025, eight years later.
The account is worth about $456,000, about 8% a year. The rule implies a doubling every nine years; it took about eleven, then eight. At that pace the million is about ten years away, roughly 30 years from the start. The bright spot is income: about $15,400 over the last 12 months, more than 15% a year on the original $100,000.
VYM: The Steady Income Fund
VYM owns hundreds of large, above-average-yield companies and charges 0.04%. It fell about 57% from October 2007 to March 2009 (to about $47,000) and recovered in April 2011. Doublings came in December 2016 (ten years in) and March 2024 (seven years and three months later). The account is worth about $564,000, about 9.1% a year, with the million roughly 6.5 years away, or 26 years from the start. Income is about $13,000 over the last 12 months, or 13% on the original money.
VIG: The Dividend Grower
VIG holds only companies with at least ten straight years of dividend raises, yields about 1.5% and charges 0.04%. It handled the crash best of the dividend funds, falling about 47% (to about $59,000 at the March 9, 2009 low) and recovering above $100,000 by April 2010, about nine months ahead of the S&P 500.
Its first doubling came in January 2017, ten years and a month in; the second in July 2021, only four and a half years later. Same fund, same rules, yet one doubling took twice as long. VIG averaged about 10% a year, but only two calendar years landed between 8% and 12%: 2012 (about 11.5%) and 2014 (about 10%). In 2008 it fell about 27%, in 2013 it rose about 29%, in 2019 almost 30%, and in 2022 it fell almost 10%.
The account is now worth about $666,000, the best of the three full-history dividend funds, with the million a little over four years away (about 24 years from the start). Year by year, it was about $77,000 at the end of 2008, $93,000 in 2009, $106,000 in 2010, $126,000 in 2012, $179,000 in 2014, $196,000 in 2016, $235,000 in 2018, $304,000 in 2019, $351,000 in 2020, $435,000 in 2021, $392,000 in 2022, $525,000 in 2024 and $599,000 in 2025. The first ten years added about $100,000; the last ten added about $470,000. Doublings start slow and finish fast, and most people quit in the slow part.
Despite a 1.5% yield, the VIG account now pays about $10,000 a year, or 10% on the original money. For more on how VIG fits into an income plan, see the 4-ETF dividend ladder.
The S&P 500 (SPY)
The index fell about 55% in the crisis and recovered in February 2011. Its doublings came in February 2017 and June 2021, within weeks of VIG's. In the last five years it pulled ahead: the SPY account is worth about $777,000, about 10.9% a year, and about 2.5 years from $1 million. The trade-off is income of about $7,700 a year, the least of the group.
SCHD: The Fastest Grower
SCHD requires ten straight years of dividends, then picks 100 stocks on cash flow, debt, return on equity, yield and dividend growth. It charges 0.06% and starts with $100,000 at the end of October 2011, so it missed the financial crisis. Its doublings came in December 2016 (five years and a month) and May 2021 (four and a half years later). The account is worth about $647,000 after 15 years, about 13.3% a year, with the million about 3.5 years away, roughly 18.5 years from its start. Income is about $19,900 over the last 12 months, almost 20% on the original $100,000.
Caution is warranted: SCHD's 15 years began in a calm period and include one of the best decades in market history. Its payout per share grew about 10.5% a year over the last ten years, but a rougher stretch would slow its doublings too. For a head-to-head comparison, read DGRO vs SCHD.
DGRO: The Bridge
DGRO holds a few hundred companies with at least five years of dividend growth and sustainable payout ratios, at 0.08%. Its doublings came in November 2020 and June 2026, two in 12 years. The account is worth about $418,000, growing about 12.3% a year, with the million about 7.5 years away, or about 20 years from its start.
The Doublings of the Paycheck
Reinvested dividends grow income in two ways: companies raise their payouts, and reinvested dividends buy more shares that pay their own dividends. VIG's first-year income of about $1,700 doubled to about $3,400 by October 2014, to about $6,800 by January 2022, and is now about $10,000, six times the first year without a new dollar added.
SCHD's first-year income of about $2,700 doubled by January 2017, April 2021 and June 2025, three paycheck doublings in under 14 years, to about $19,900 today. Its dividend growth of about 10.5% a year doubles the payout about every seven years, and reinvestment on top doubled the paycheck about every four years.
What would $1 million pay once you get there? On today's yields: DVY about $33,800 a year, SCHD about $31,000, VYM about $23,000, DGRO about $19,000, VIG about $15,000 and the S&P 500 about $10,000. The fastest builder is not always the biggest payer. For the income side of the story, see the dividend crossover point.
Four Levers That Speed Up the Doublings
Lever 1: Time
Each extra doubling is worth more than all before it. VIG's first doubling added $100,000, the second $200,000; a third would add $400,000 and a fourth $800,000. As a projection, not a promise, $100,000 left for 30 years becomes about $1 million at 8%, about $1.745 million at 10% and about $3 million at 12%. Scale to your own amount: with $250,000, VIG's 20-year pace would already be about $1.67 million.
Lever 2: Monthly Deposits
With $500 added at the start of every month, VIG crossed $1 million in November 2025, after 18 years and 11 months. It is now worth about $1.12 million on total deposits of $219,000, so about $900,000 is growth. VYM crossed in July 2026 (about 19.5 years), the S&P 500 in November 2024 (about 18 years), while DVY sits at about $843,000. At $1,000 a month, VIG crossed in December 2023 (17 years), the S&P 500 in October 2021 (under 15 years) and SCHD in February 2026 (about 14 years and three months). Deposits made in late 2008 and early 2009, at the lowest prices, bought the most shares.
Lever 3: Growth Rate and Fees
The gap between 8% and 10% was the gap between DVY's $456,000 and VIG's $666,000, about $210,000. Some of that is strategy and some is cost: DVY charges 0.38% versus VIG's 0.04%. Reinvesting dividends supplied about 38% of VIG's growth (price alone would have left about $449,000), 55% of VYM's (about $309,000 on price alone), 66% of DVY's (about $223,000) and 35% of the S&P 500's. In a taxable account, reinvested dividends are still taxed in the year paid, which slows high yielders slightly. Investopedia notes that a 1% fee turns a 7% return into 6%, stretching a doubling from about 10 to 12 years, or about 5.5 extra years to reach $1 million.
Lever 4: Behaviour
On March 9, 2009, the VIG account was worth about $59,000. Selling would have locked that in; holding gave about $666,000 today. DALBAR's 2026 report, covering 2025, found the average equity fund investor earned about 17.2% while the S&P 500 returned about 17.9%. In 2024 the gap was far larger: about 16.5% versus about 25%. Related reading: pausing dividend ETFs cost $13,900.
A fifth factor you cannot control is your start date. $100,000 in VIG on March 9, 2009 is worth about $1.13 million today, a million from one deposit in 17.5 years. The same amount on October 9, 2007, the pre-crisis peak, is worth about $601,000, a difference of about $500,000 from starting points 17 months apart. Monthly deposits ensure some money lands at the bottom.
The Bottom Line
With no new money, 20 years was not enough for any fund. At the best funds' pace it takes about 18 to 24 years; at a high-yield pace, closer to 30. Adding $500 a month got the best fund there in about 19 years, and $1,000 in about 17. Inflation matters too: prices rose about 67% over the 20 years, so today's $1 million buys about what $600,000 did in 2006. Still, VIG's $666,000 is about four times the buying power of the original $100,000.
If starting today, the data suggests growth-oriented dividend funds (SCHD as the foundation, VIG or DGRO alongside, or the S&P 500 for the fastest pile), monthly deposits even in downturns, tiny costs, a promise not to sell in a crash, and patience for lumpy doublings.
Watch the Full Video
For a visual walkthrough of every doubling date and chart, watch the video: I Checked 20 Years of Real Returns: How Long $100,000 in Dividend ETFs Takes to Hit $1 Million. The next video in the series covers all four types of compounding: Most Investors Only Use 1 Type of Compounding - Here Are All 4.
This article is for education only and is not financial advice. Projections are not promises, and the next 20 years will differ.