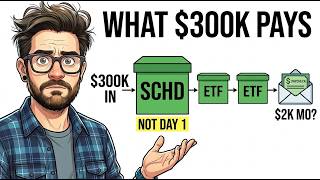
Three hundred thousand dollars invested in three dividend ETFs does not hand you a $2,000 monthly paycheck on day one — but it can build one. The distinction matters enormously, because investors who confuse the starting income with the destination income either give up too early or reach for dangerously high yields trying to close the gap. This breakdown covers the honest arithmetic: where the income starts, why it grows without adding more money, and how a $300,000 three-fund blend has historically compounded its own payout toward that $2,000 target.
Key Takeaways
- A $300,000 dividend ETF portfolio using the three-role blend starts near $800–$900 per month at a blended yield just over 3%.
- SCHD has raised its dividend for 13 consecutive years at roughly 9% annually — the backbone of any income-stability argument.
- DGRO grows its payout at roughly 7% per year and is the portfolio's fastest long-term compounder despite its low starting yield of approximately 1.9%.
- DIVO pays monthly at close to 5%, but its covered-call structure caps growth potential and its 0.56% expense ratio is nearly ten times SCHD's fee.
- At a historically informed blended income growth rate of roughly 7% per year, the monthly check could reach $1,700–$1,800 in ten years without adding a single new dollar.
- Yield on cost — measuring income against the original purchase price — is the mechanism that makes a growing-dividend blend outperform a flat high-yield fund over time.
What $300,000 in Dividend ETFs Actually Pays From Day One
The honest starting number on this three-fund blend is somewhere between $800 and $900 per month gross — not $2,000. A blended yield just over 3% on $300,000 produces roughly $9,000 to $10,800 per year, or about $800–$900 monthly. That is the real starting line, and acknowledging it is the first step in building an income stream that actually holds up over time.
The path to $2,000 a month does not run through finding a higher-yielding fund on day one. It runs through selecting funds whose payouts raise themselves, then letting time and compounding do what impatience never can. That distinction — between chasing today's yield and building tomorrow's income — is the entire logic behind the three-role framework. Anyone who promises $2,000 a month from day one on this balance has skipped the arithmetic.
The Three-Role Dividend Paycheck Framework
The portfolio is built around three distinct jobs: an anchor for stability and consistent raises, a raiser for long-term dividend growth, and a booster to lift today's cash flow. No single fund has to be perfect, because each one covers a weakness the other two have. That is genuine diversification by income function — and it is what keeps the machine running when one role underperforms.
Role 1 — The Anchor: SCHD
Schwab US Dividend Equity ETF (SCHD) is the foundation of this income structure. It currently yields approximately 3.25% with an expense ratio of just 0.06% — roughly $6 per year for every $10,000 invested. SCHD holds about 100 high-quality U.S. companies selected for dividend durability rather than maximum yield. These are businesses that have kept paying and raising their dividends through recessions, market crashes, and volatile macro environments.
The defining credential is its consistency: 13 consecutive years of dividend increases, with a five-year dividend growth rate of approximately 9% per year. In dividend investing, that kind of track record is the product itself. A fund that raises its payout through difficult markets has demonstrated that the underlying businesses generate durable cash flow regardless of what the headlines are doing — which is the difference between a paycheck that can anchor a retirement plan and a yield that vanishes the first time conditions get rough.
In this allocation, $120,000 sits in SCHD. At a 3.25% yield, that generates roughly $3,900 per year — about $325 per month. Steady, predictable, and built to raise itself every year without any additional action required.
Role 2 — The Raiser: DGRO
iShares Core Dividend Growth ETF (DGRO) is not in the portfolio for its starting yield. At approximately 1.9%, it is the lowest of the three funds. Its expense ratio of 0.08% makes it nearly as cheap to own as SCHD. The case for DGRO is entirely about trajectory: over the last five years, it has grown its dividend at roughly 7% per year, and it is structurally tilted toward companies with a demonstrated history of consecutive payout increases.
With $75,000 allocated here, DGRO currently generates about $1,450 per year — roughly $120 per month. That income looks modest today, but DGRO is the portfolio's fastest long-term growth engine. It is purchased for what it pays in a decade, not what it pays this quarter. For a deeper look at how SCHD and DGRO diverge across different holding periods, DGRO vs SCHD: The Dividend Growth Stall Investors Need to See examines the trajectory in detail.
Role 3 — The Booster: DIVO
Amplify CWP Enhanced Dividend Income ETF (DIVO) changes the texture of the portfolio because it pays every month — twelve distributions per year rather than four. Its current distribution rate is close to 5%, the highest cash flow of the three. DIVO achieves this partly through a covered call strategy, which involves selling a portion of potential price upside in exchange for additional income today.
Three honest trade-offs accompany that monthly income. First, DIVO's expense ratio is 0.56% — nearly ten times SCHD's fee. Second, the covered call overlay caps the fund's upside in strong bull markets; DIVO tends to lag funds that simply hold their underlying stocks when equities surge. Third, DIVO's distributions can mix qualified dividends, short-term gains, and return of capital, which creates more complexity at tax time than SCHD's predominantly qualified dividends. Holding DIVO inside a tax-sheltered account where possible reduces that third issue significantly.
Used in the right proportion, however, DIVO does its job precisely: it lifts today's income. With $105,000 allocated here, DIVO generates roughly $5,000 per year at close to 5% — approximately $420 per month, arriving in twelve equal monthly installments.
The Honest Combined Starting Income
Adding up all three roles across the $300,000 allocation:
- SCHD — $120,000 at 3.25%: approximately $325/month
- DGRO — $75,000 at 1.9%: approximately $120/month
- DIVO — $105,000 at ~5%: approximately $420/month
The combined monthly income sits near $865 per month at a blended yield just over 3%. In the first year, this portfolio generates roughly $11,000 in total distributions — not $24,000, not $2,000 a month — but a base that the portfolio is already working to raise through built-in dividend growth.
The blend also smooths the payment calendar in a way that purely quarterly funds cannot. SCHD and DGRO pay four times a year; DIVO pays twelve. Combined, income arrives nearly every few weeks rather than in long quarterly gaps — a meaningful practical advantage for anyone managing retirement cash flow. For a related look at how a four-ETF structure handles similar income timing, see 4-ETF Dividend Ladder: How VIG, DGRO, SCHD & DIVO Pay $613/Month.
How Yield on Cost Carries the Monthly Check Toward $2,000
The path from $865 to $2,000 per month does not require adding more capital. It requires time and the mechanism behind it: yield on cost.
Yield on cost measures what an investment pays against its original purchase price — not today's market value. As SCHD raises its dividend roughly 9% per year and DGRO raises its roughly 7%, the actual dollar income paid on the original $300,000 grows — even though the sticker yield for a new buyer coming in today stays relatively constant. A position purchased at a 3.25% yield, after ten years of approximately 9% annual raises, could pay its original holder closer to 7–8% on original cost. That gap is the reward for buying early and holding.
At a blended income growth rate of approximately 7% per year — drawn from SCHD's historical 9% and DGRO's historical 7% — the $865 monthly starting income could grow toward $1,200–$1,300 per month after five years and $1,700–$1,800 per month after ten years, using the same three funds and the same $300,000.
These are historically informed projections, not guarantees. A deep recession could freeze or cut dividend payouts. The booster could lag substantially in a prolonged bull market. But the directional logic is sound: a portfolio anchored in growing-dividend funds compounds its own income without requiring the investor to contribute new capital. Once the portfolio's yield on cost crosses the income level of a flat high-yield fund, the patient investor wins the long game permanently — the flat fund pays the same forever, while this blend delivers a raise every year.
The Patience Trap: Why High Yield Is Often a Warning Sign
The most common mistake investors make with this portfolio structure is abandoning it in year one because the starting income feels too small. Three hundred thousand dollars producing $865 a month can feel like underperformance when promotions claim $2,000 from day one. The instinctive response is to shift entirely into the single highest-yielding fund available — 8%, 9%, sometimes higher — to close the gap immediately.
That move typically backfires in two ways. First, yields that high are often a signal of elevated risk: distributions that will eventually be cut, funds built on return of capital that slowly liquidates the investor's own principal, or strategies that deteriorate as interest rates shift. Second, even when the high yield holds, it rarely grows. A flat 8% yield does not compound. A 3.25% yield growing at 9% per year does — and it historically crosses the flat yield's income level before the end of the first decade. The patient path accepts the smaller starting check deliberately, then lets the raise stack on top of the raise, year after year, until the check that started at $865 looks small compared to the one it became.
Watch the Full Video Breakdown
For a visual walkthrough of the allocation math, the year-by-year income projections, and the yield-on-cost mechanics explained with real numbers, watch the full video on YouTube. Every figure cited was pulled fresh and cross-checked before recording, and the video covers DIVO's covered-call trade-offs in specific detail.
Watch: How $300,000 in Dividend ETFs Grows Into a $2,000 Monthly Paycheck →
This article is for educational purposes only and does not constitute financial advice. Dividend yields, expense ratios, and growth rates cited are illustrative and subject to change. Past performance does not guarantee future results. Always conduct your own research before making any investment decision.