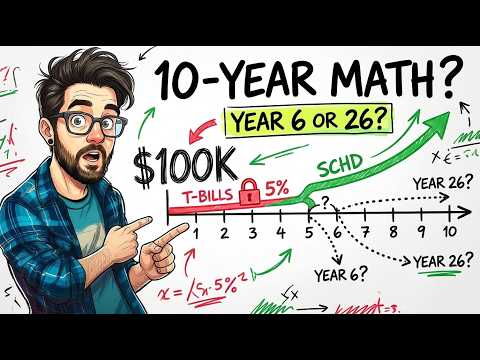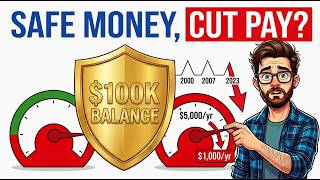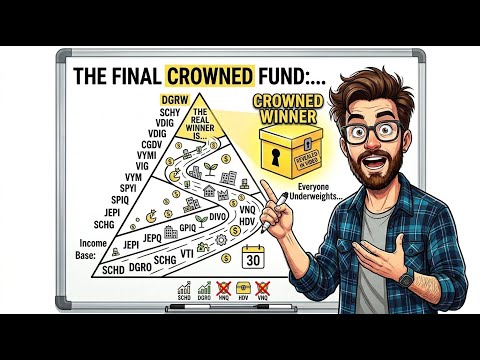
Treasury bill funds like SGOV pay about 4% right now, roughly ten times the average savings account. That feels safe, and for your principal it is. But what happens to that income when rates fall? To find out, I modelled $100,000 parked in rolled 3-month Treasury bills at each of the three rate peaks since 2000 (November 2000, February 2007 and October 2023) and compared the results with the same money in dividend funds on the same day.
The model uses the Federal Reserve's monthly 3-month T-bill rate plus published fund prices and dividends. It is not a real account. It is education, not financial advice.
Key Takeaways
- Two of the three times, T-bill income collapsed within three years: from about $6,170 a year to about $1,011 after 2000, and from about $5,030 to about $150 after 2007.
- After the 2007 peak, the bills paid about $568 in total across the seven years from 2009 to 2015.
- The principal never lost a dollar in any of the three tests.
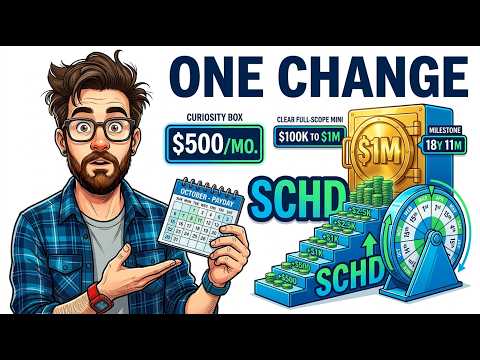
- From the October 2023 peak, bills and SCHD paid almost the same cash (about $13,108 vs $13,103), but the SCHD shares are now worth about $151,000 against $100,000 for the bills.
- The split I'd use: park what you'll need in the next 2-3 years and put the rest to work.
What T-Bills and SGOV Actually Pay Today
A common Reddit question asks why yields are "above 5%" while stocks wobble. That figure is the 10-year Treasury, which closed at about 5.1% on October 20. A Treasury bill fund tracks the much shorter 3-month bill, which is a little over 4% right now.
On September 16, the Federal Reserve raised its target range by a quarter point, to 3.75% to 4%. The minutes, published in early October, reported that most officials thought another increase would likely be appropriate by the end of the year. That is their view, not a promise.
SGOV, the iShares 0-3 Month Treasury Bond fund, paid about 3.7% over the last twelve months. Its latest monthly payment was about 30 cents a share on a share price of about $100. The national average savings rate, based on FDIC data released this week, is about 0.38%, or about $380 a year on $100,000. The Treasury fund pays about $3,700. BIL from State Street costs about 0.14% and paid about the same, close to 3.7%. SCHD, the Schwab U.S. Dividend Equity fund, yields about 3% today.
Is SGOV Riskier Than a Savings Account?
SGOV holds U.S. Treasury bills that come due in three months or less. It costs 0.09% a year, or $9 on every $10,000, and holds about $114 billion. Since launching in 2020, its share price has never closed below about $99.97 or above about $100.75. Over the last year the whole range was about 45 cents.
There are differences from a bank account. A savings account at an insured bank is covered by the FDIC up to $250,000 per depositor, per bank, per ownership category. The Treasury fund is not FDIC insured; what stands behind it is the bills it owns, which are debts of the U.S. government. Treasury bill interest is also taxed federally but exempt from state and local income tax, while savings interest is taxed by both. That is a small edge in a high-tax state, so check how it applies to you.
For your principal, both are about as safe as money gets. The real risk in both is that the rate is not yours to keep.
How T-Bill Income Resets
A 3-month bill matures in three months, then the fund buys a new one at that day's rate. The whole fund turns over every few weeks. When rates rise, income rises fast. When rates fall, income falls just as fast. Nothing is locked in.
SGOV's own record shows it: about $4.88 a share in 2023, about $5.12 in 2024 and about $4.12 in 2025, a pay cut of about a fifth in one year from a fund whose price barely moved. A quarter-point increase on a roughly $100 share adds about two cents a month once the fund has rolled into the new bills. Monthly payments have stayed close to 30 cents in August, September and October.
A dividend fund works the other way. The price moves every day, but the payout comes from company profits and tends to change slowly, usually upward. One kind of safety protects the money; the other tends to protect the income.
Peak 1: November 2000
In November 2000 the 3-month bill rate averaged about 6.17%. Parked $100,000 paid about $6,170 a year, or roughly $514 a month. Then the Fed cut rates again and again. Interest came to about $3,390 in 2001, about $1,600 in 2002 and about $1,011 in 2003. Monthly interest went from about $429 in January 2001 to about $141 in December 2001. Within three years the paycheck fell from about $514 a month to about $84, a drop of more than 80%.
For someone needing $500 a month, the interest covered only about $6,000 of the $18,000 needed from 2001 to 2003. The other roughly $12,000 came out of the principal. Income did not climb back above $4,500 a year until 2006.
The same day in the S&P 500
$100,000 in SPY at about $142 a share yielded about 1%. It paid about $999 in 2001, about $1,051 in 2002, about $1,144 in 2003 and about $1,542 in 2004, so by 2003 stock income was already above bill income. The price pain was real: by October 9, 2002 the shares were about $78, down about 45%, and in March 2009 the original $100,000 was worth about $47,800. Even dividends fell about a fifth, to about $1,529 in 2009 from about $1,910 in 2008.
For the first ten years the bills won. By November 2010 the shares were worth about $83,200 plus about $14,700 in dividends, roughly $98,000, against about $124,900 for reinvested bills. But held to today, reinvested bills are worth about $160,000, while reinvested S&P 500 shares are worth about $850,000, and the original shares alone now pay about $5,300 a year, more than bills pay at today's rate.
Peak 2: February 2007
In February 2007 the 3-month rate averaged about 5.03%, paying about $5,030 a year. Interest fell to about $1,365 in 2008 and about $150 in 2009. In January 2008 the monthly interest was about $229; by December 2008 it was about $2.50. Later years: about $137 in 2010, about $53 in 2011 and about $32 in 2014. Across the seven years from 2009 to 2015 the bills paid about $568 in total.
Someone needing $5,000 a year would have needed $35,000 over those seven lean years; interest supplied about $568 and roughly $34,400 came from principal. BIL, launched in May 2007, paid less than one cent a share combined from 2010 through 2015 and nothing in 2021. A smaller version of the pattern followed: about $2,061 in 2019, about $365 in 2020 and about $44 in 2021.
The same day in DVY, VYM and VIG
$100,000 went into each of three dividend funds on February 1, 2007: DVY (iShares Select Dividend), VYM (Vanguard High Dividend Yield) and VIG (Vanguard Dividend Appreciation). In 2008 they paid about $3,364, $2,757 and $1,865. In 2009 DVY paid about $2,310 (down about 31%), VYM about $2,232 (down about 19%) and VIG about $1,779 (down about 5%). The bills' cut was about 97% and lasted seven years.
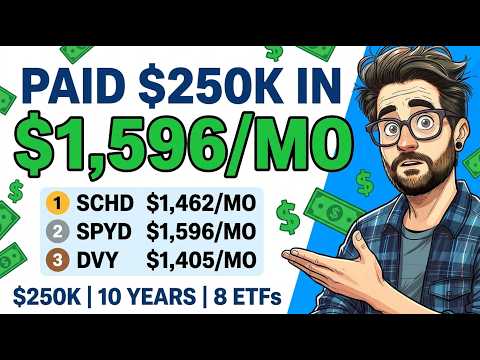
Over 2009 to 2015, VIG paid about $17,000, VYM about $21,000 and DVY about $20,200, against $568 from bills. But prices fell hard: at the March 2009 low, DVY was worth about $36,500, VYM about $43,800 and VIG about $55,500. Ten years on, in February 2017, VIG was about $156,700 plus $23,900 in dividends, VYM about $144,000 plus $30,600, and DVY about $124,000 plus $30,600, against about $106,500 for reinvested bills. Today the original shares pay about $6,600 (VIG), $7,000 (VYM) and $7,400 (DVY) a year. Reinvested to today, bills are worth about $135,500, VIG about $660,000, VYM about $566,000 and DVY about $461,000.
Peak 3: October 2023
In October 2023 the rate averaged about 5.34%, paying about $5,340 a year. Bills paid about $4,967 in 2024 and about $4,067 in 2025. This year the rate has averaged a little under 3.75%, and after the September increase it is a little over 4%. At its lowest this was a slide of about a third; today about a quarter, and it is rising again.
$100,000 in SCHD on October 2, 2023 at about $23.39 a share (split-adjusted) bought about 4,275 shares. They paid about $4,251 in 2024, about $4,478 in 2025 and about $4,506 over the last twelve months. SCHD's payouts have been roughly flat this year, but flat is very different from a cut of a quarter.
Total cash from October 2023 through September: bills about $13,108, SCHD about $13,103. SGOV itself, bought that day at about $100.27, paid about $13,200 and is still worth about $100,350, within about 1% of the model. The difference is everything else: the SCHD shares are worth about $151,000 and their roughly $4,500 paycheck is now above the bills' about $4,080 at today's rate. It was not free: on October 27, 2023 the shares were worth about $95,300, down about 5%.
The Pattern Across All Three Peaks
The parked money protected the principal. It never fell below $100,000 in 2002, March 2009 or October 2023. But it did not protect income: that fell more than 80% after the first peak, about 97% after the second and by up to about a third after the third. It fell fastest when the economy was weak, because rates get cut in bad times. Dividend funds did the reverse: prices fell about 45% to 65% at the worst points, but paychecks fell far less, or not at all, and then grew.
If you need the money in the next year or three, for a roof, car or house down payment, Treasury bills are the right place. If you need income for twenty years, bills failed that job twice since 2000. For readers who want to see how dividend income can be built in layers, see the 3-bucket dividend strategy.
The Split I'd Use
The rule is simple: park the money you'll need in the next two to three years and put the rest where its income can grow. A 10-year bond locks in a rate but risks price; a 3-month bill protects price but risks income.
Run through the third peak: $30,000 in bills and $70,000 in SCHD, all income spent. The parked $30,000 pays about $1,220 a year; the SCHD part is worth about $105,700 and paid about $3,150 over the last twelve months. Together about $135,700 paying about $4,380 a year, more than the all-parked version's about $4,080, with about $36,000 more money.
Run through the worst start, February 2007, with $30,000 in bills, $35,000 in VIG and $35,000 in VYM: the whole thing paid about $2,027 in 2008 and about $1,449 in 2009, down about 29%, while the all-parked version fell from about $1,365 to about $150. At the March 2009 low the $70,000 of stock was worth about $34,800, but the untouched floor meant nothing was sold at the bottom. Ten years on the stock part was worth about $105,300 plus the $30,000 floor, and the split paid about $20,900 in cash against about $6,200 from all bills. Today that stock part is worth about $264,000 and pays about $4,780 a year on its own.
A 44-year-old with twenty years to go might keep a smaller floor, closer to an emergency fund; someone retiring next year might hold closer to 30%. If you want to see how a dividend portfolio turns into a paycheck, read about the dividend bridge. Nobody knows whether today is a peak or the start of a new climb, and the split works either way.
Watch the Full Video
For the month-by-month charts and the side-by-side comparisons, watch the full video walkthrough: I Parked $100,000 in T-Bills Like SGOV at Every Rate Peak Since 2000. The next video in the series covers what happened when SCHD's yield fell below a T-bill.
This is not financial advice. These are hypothetical models from three start dates; different dates give different results. Dividends can be cut, and past performance does not guarantee future results.